Global GDP Components Analysis 2024: US, China, India & Nepal Economic Structures
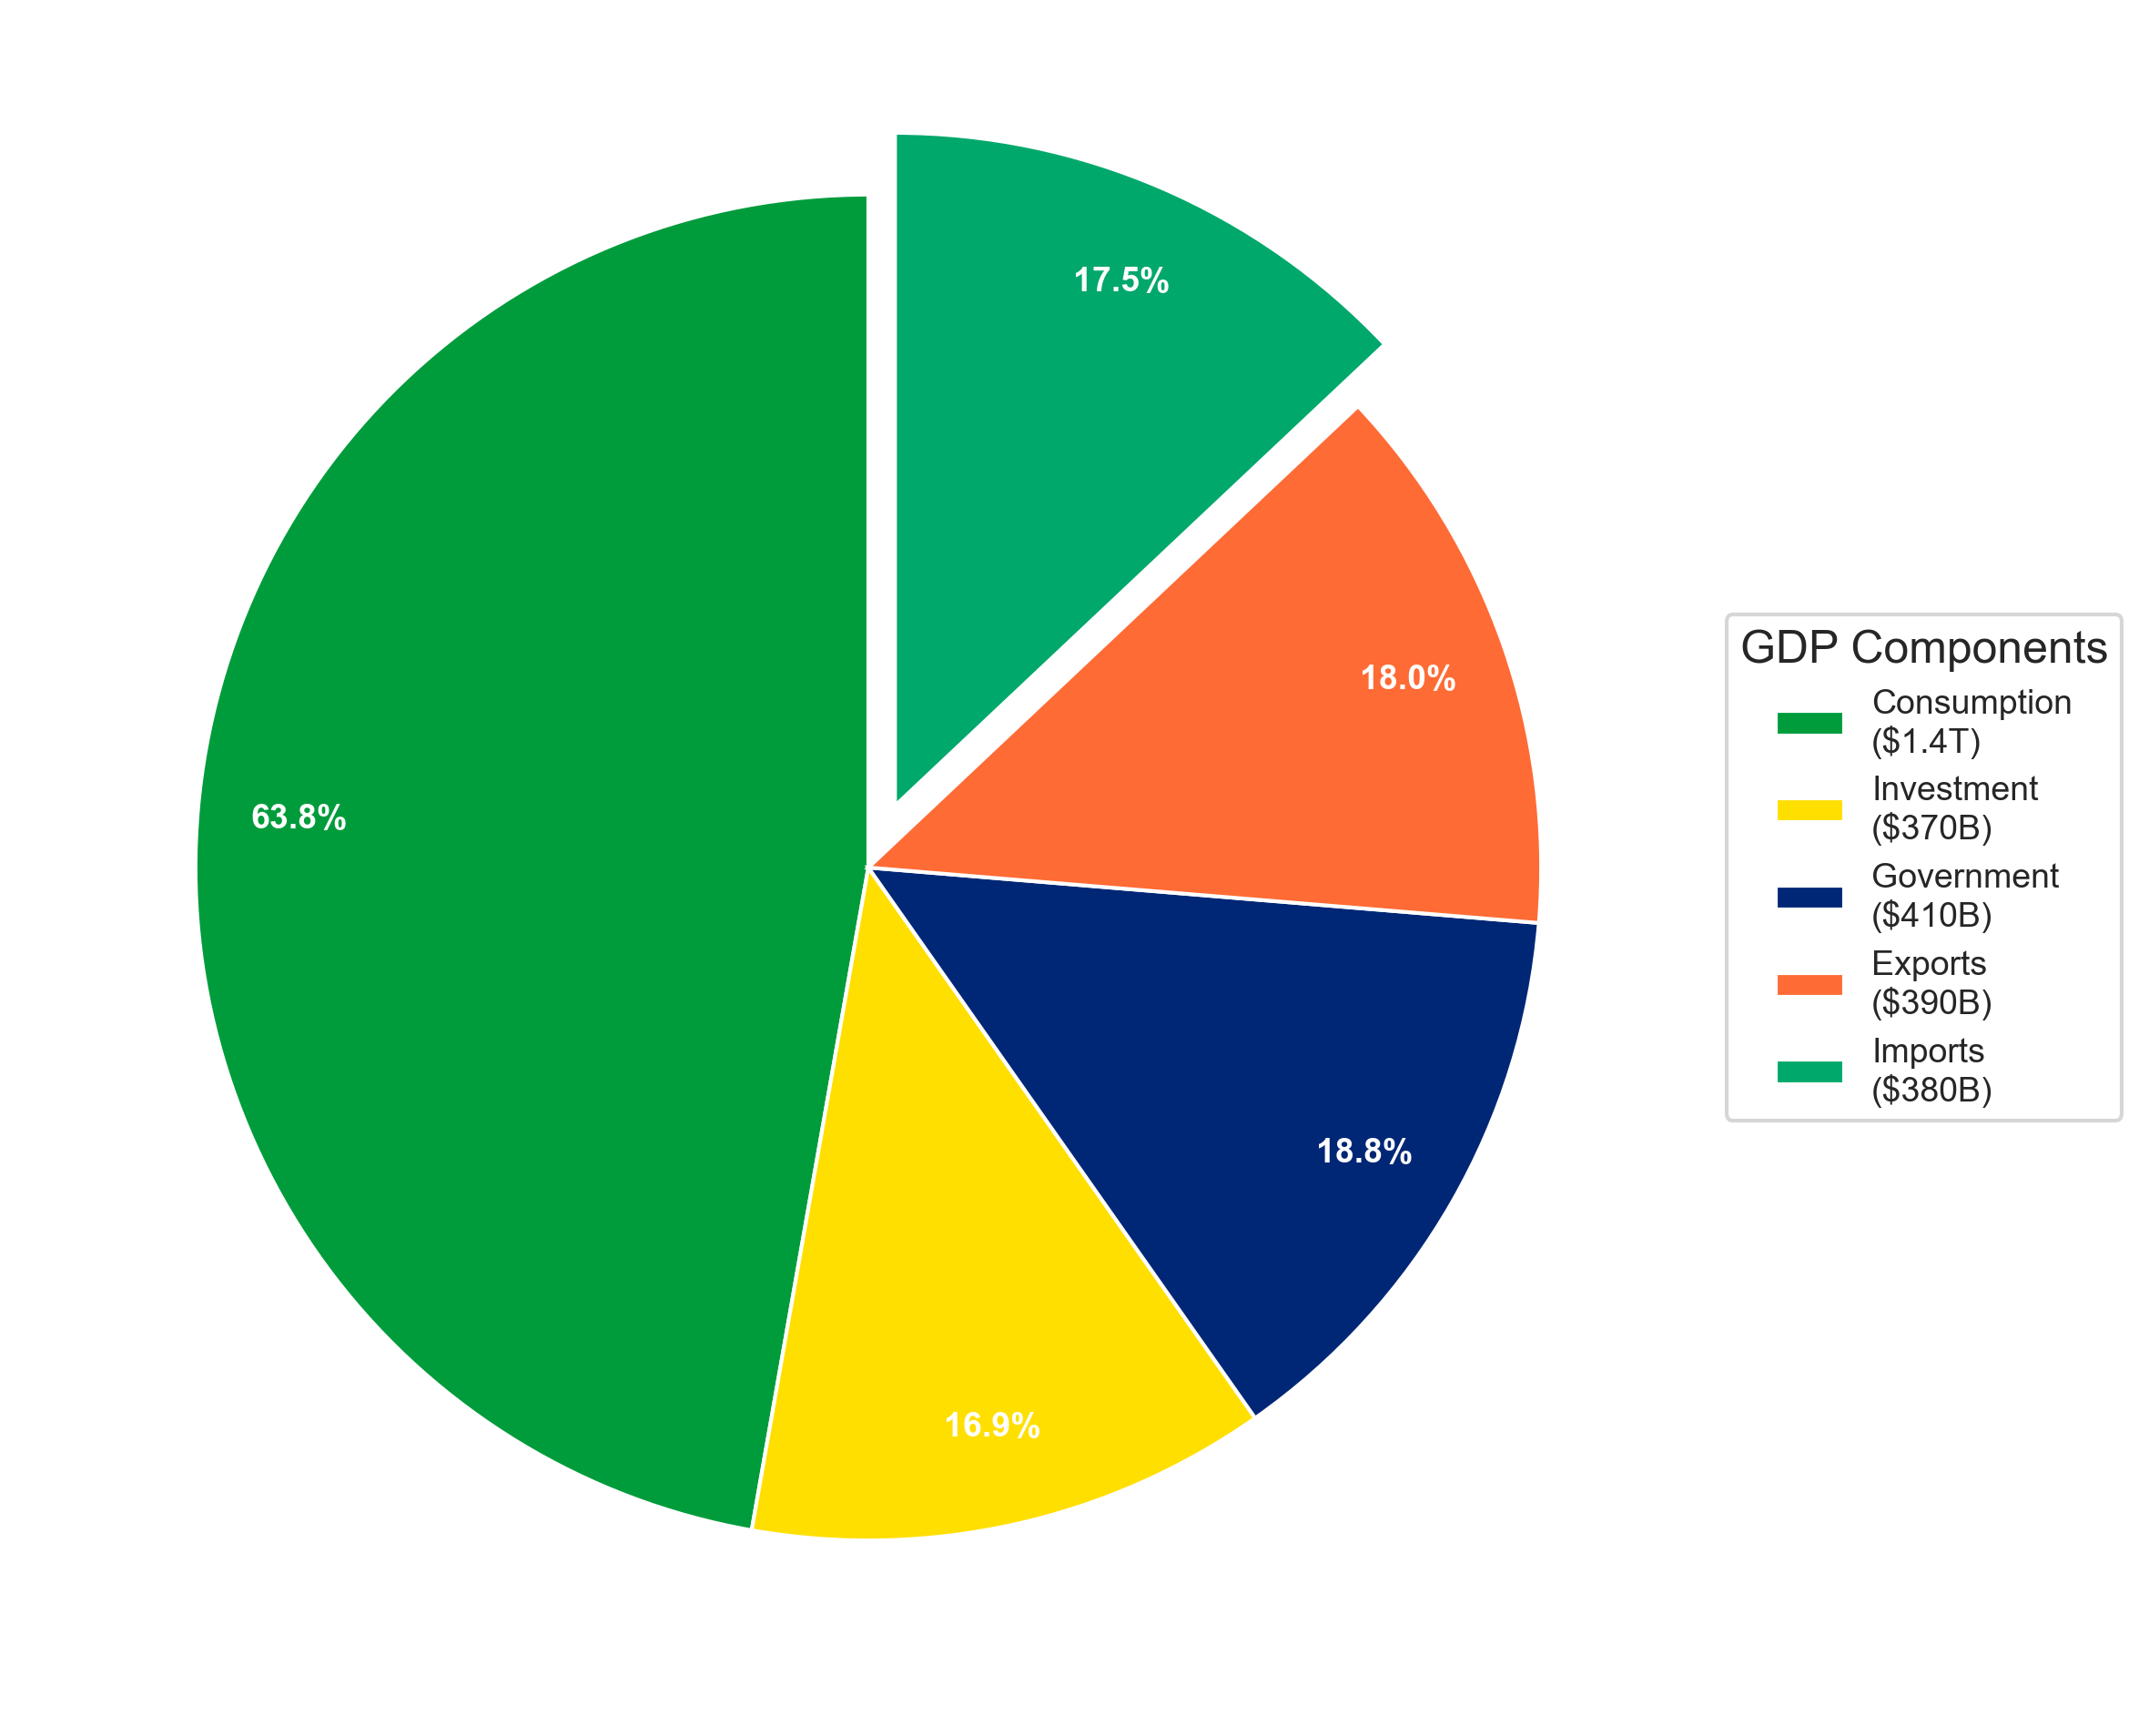
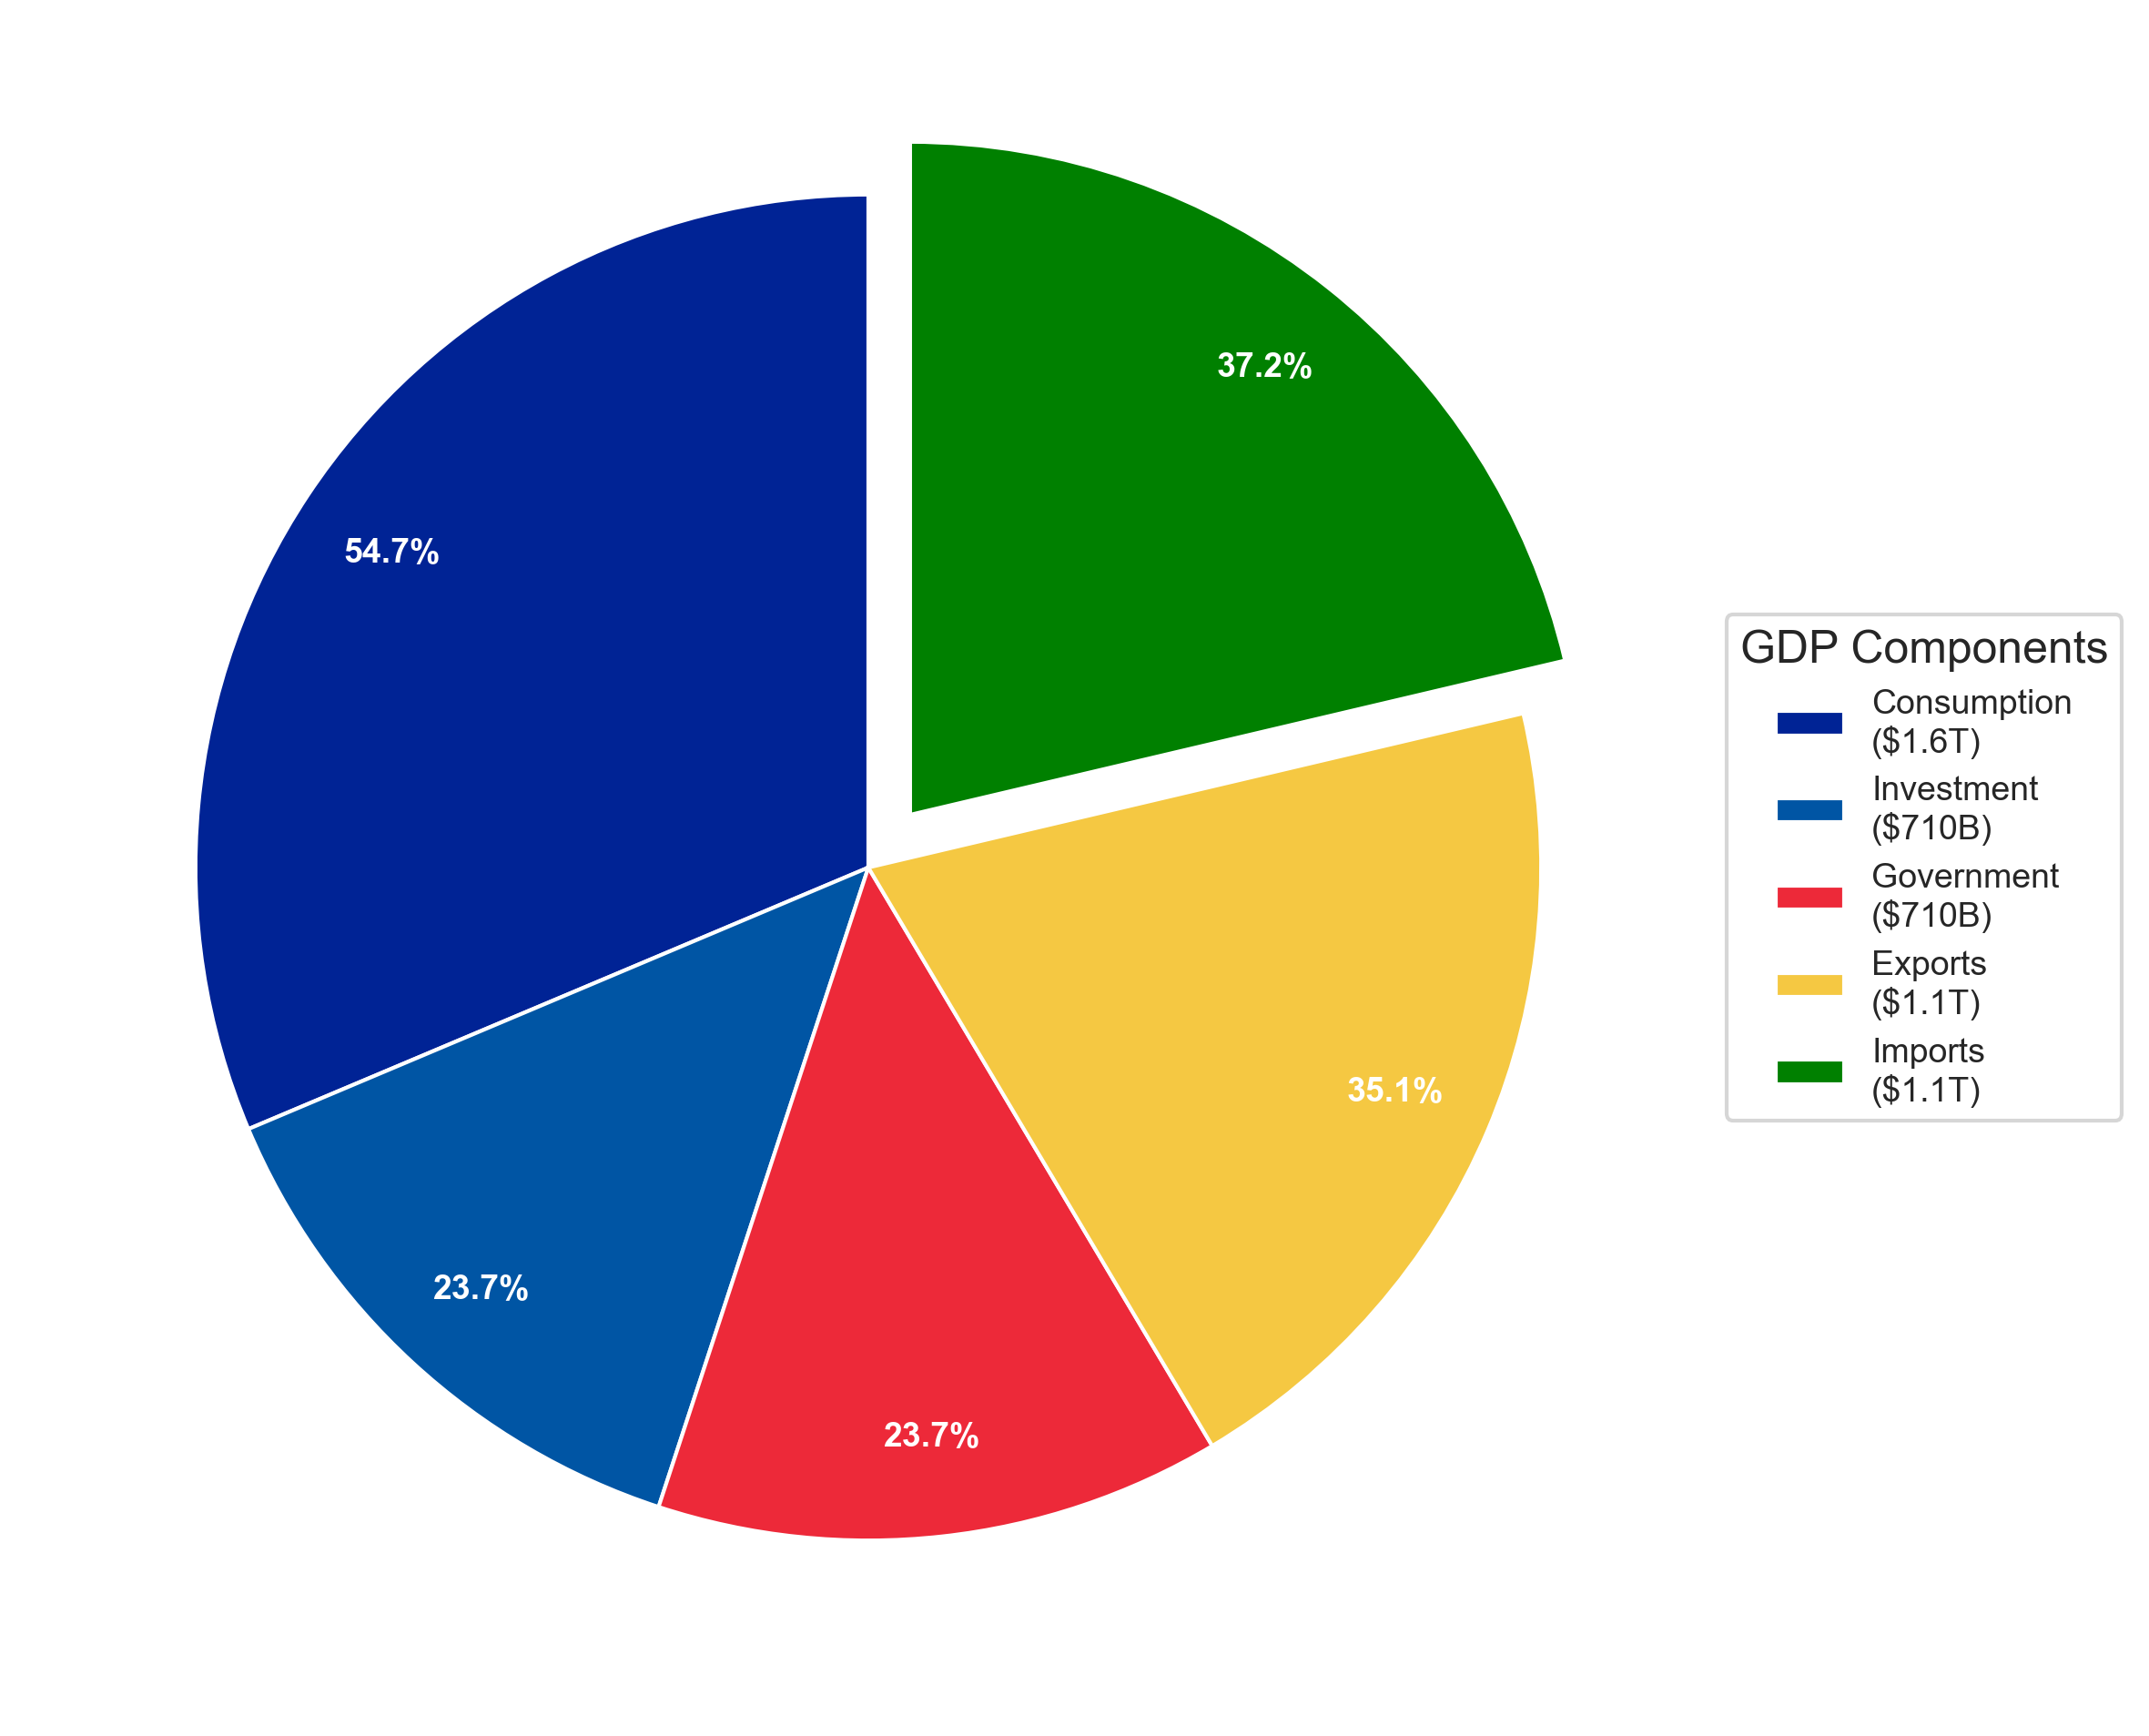
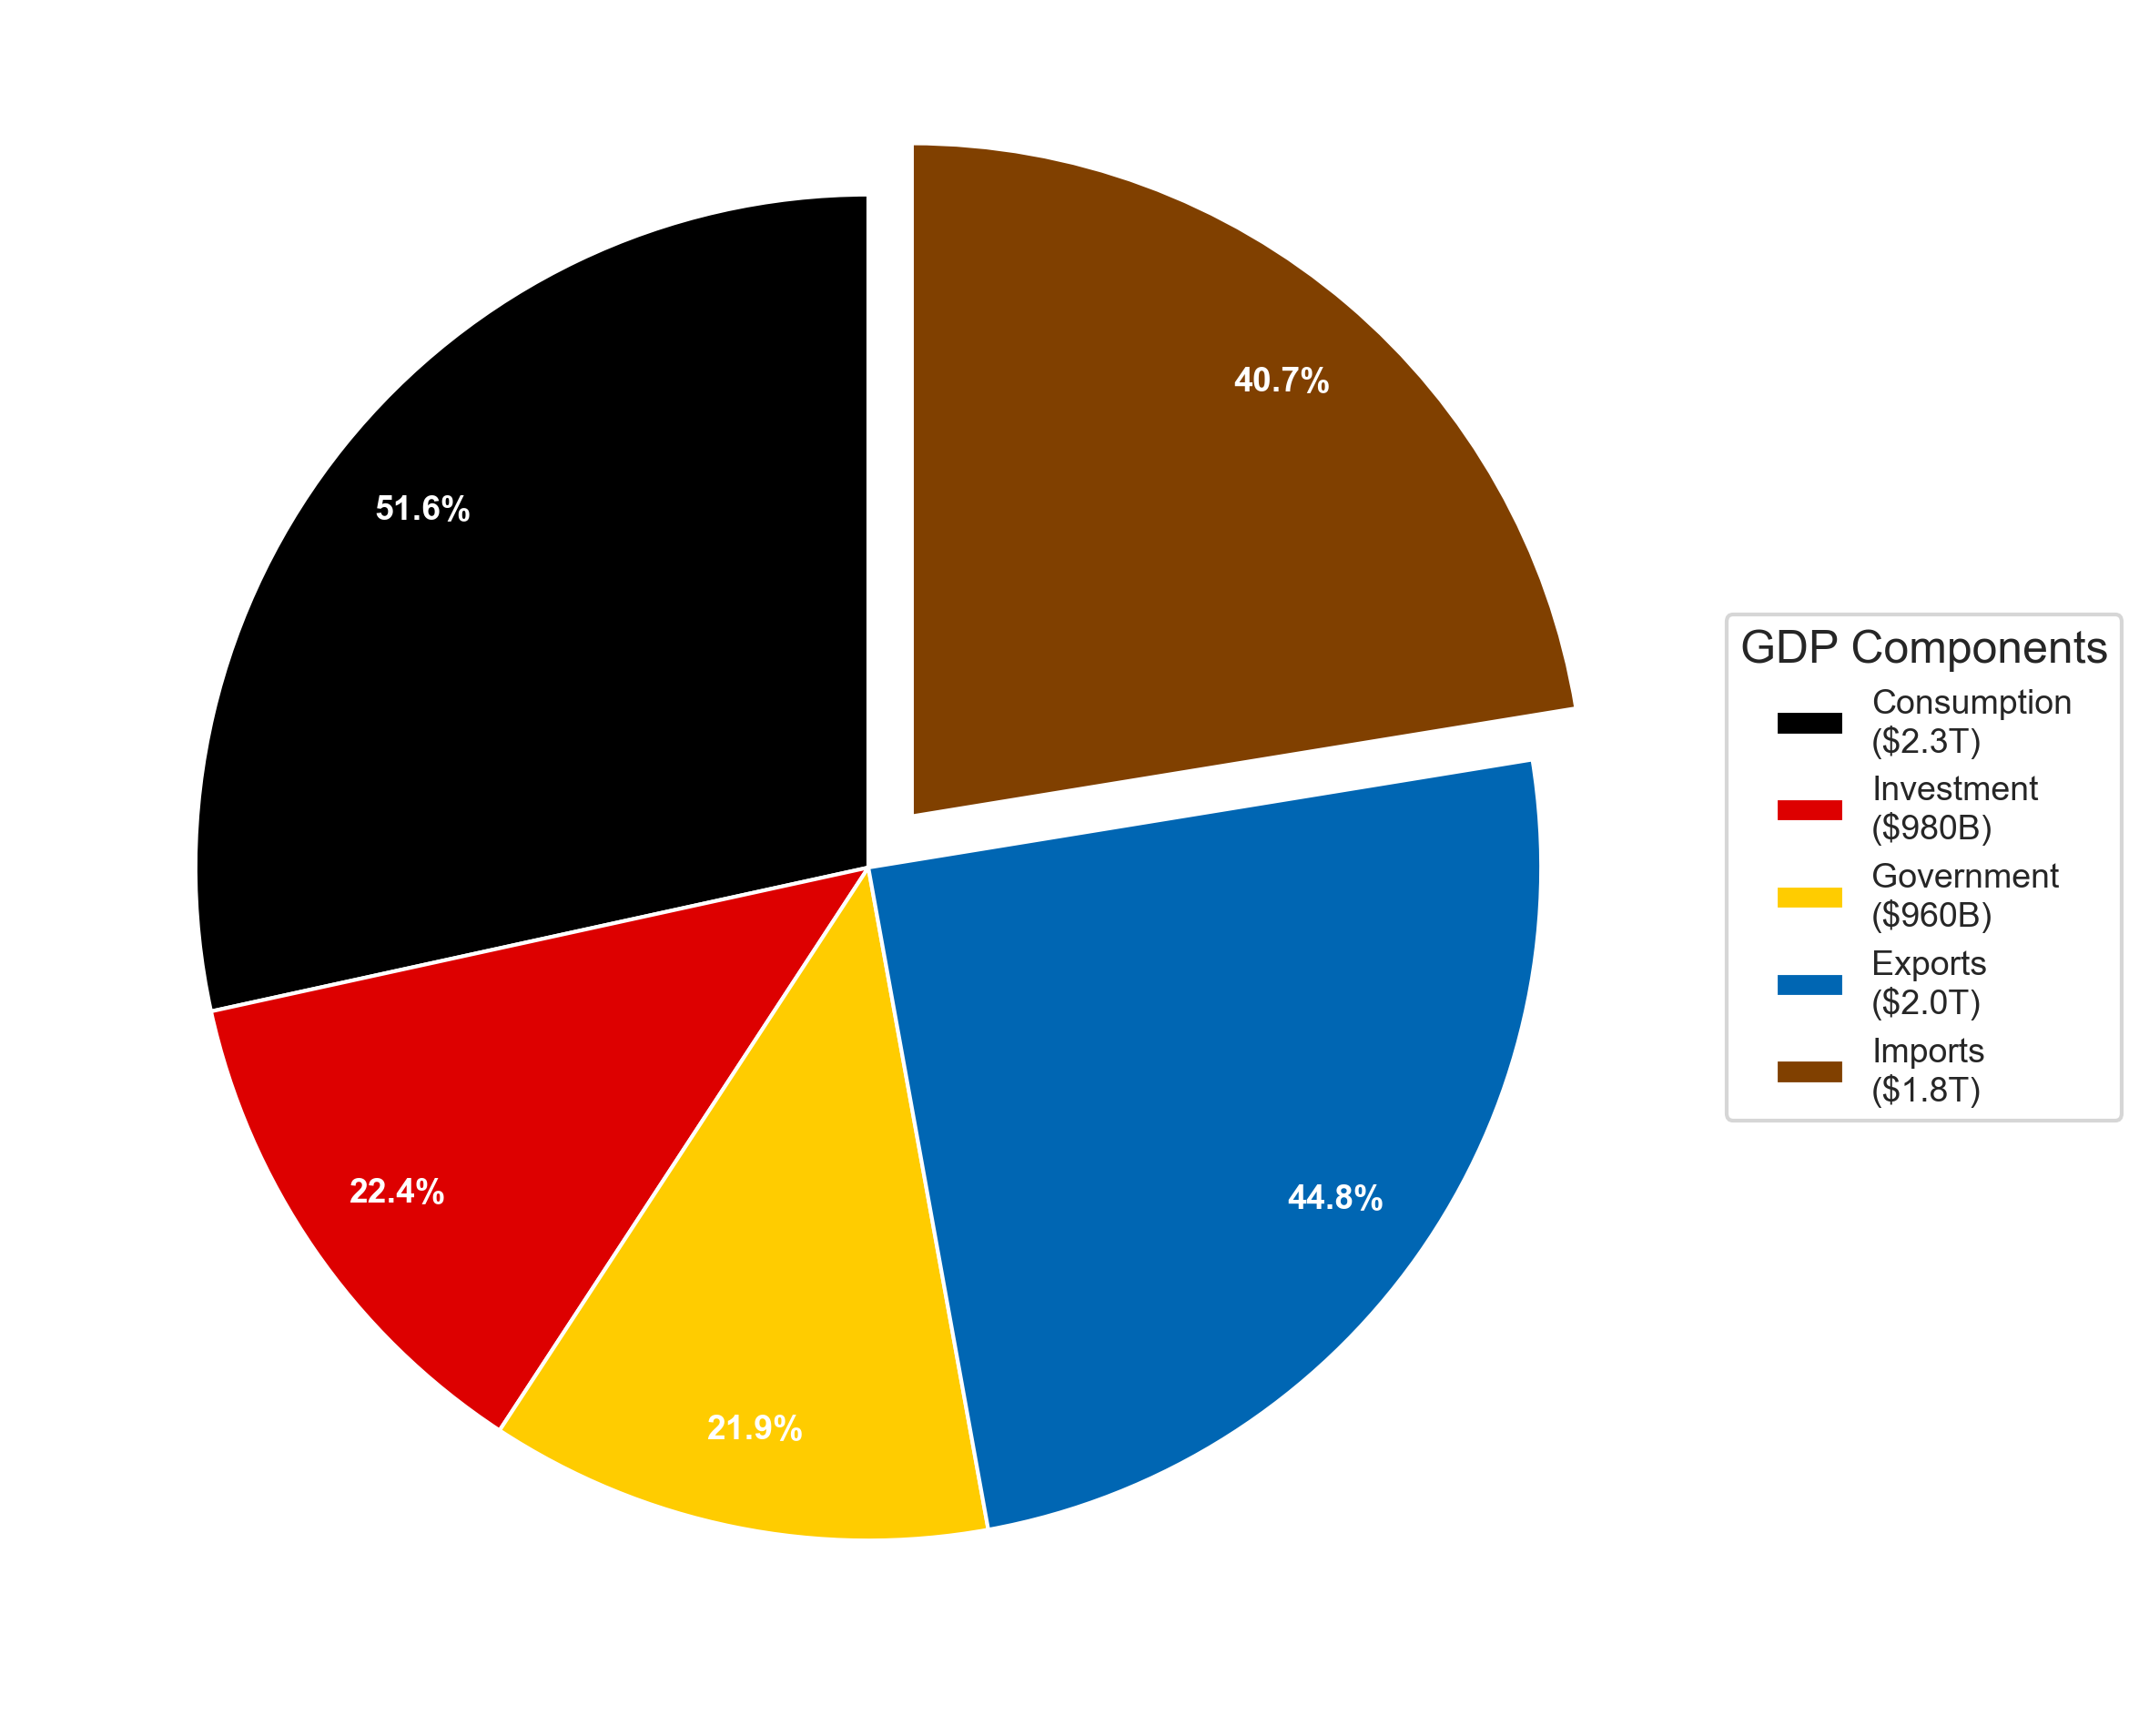
🇺🇸 United States GDP Analysis 2024 The components of US Gross Domestic Product (GDP) for the year 2024 Table: US GDP measured by components of demand for the year 2024 Component Amount (trillions of $) Percent Pie chart percent Consumption 19.928167 67.89% 52.90% Investment 5.347692 18.22% 14.20% Government 5.032578 17.14% 13.36% Exports 3.204134 10.92% 8.51% Imports 4.15825 -14.17% 11.04% Total GDP 29.354321 100.00% 100.00% The components of US Gross Domestic Product (GDP) for the year 2023 The pie chart and table present recent data about the four different components of the United States’ Gross Domestic Product (GDP), including their corresponding amounts and percentages. Examining the table, we can see that the total GDP of the United States in Q4 of 2022 was valued at 26.14 trillion US dollars. Consumption was the biggest contributor to the GDP, amounting to 17.74 trillion US dollars, which makes up 67.91% of the total GDP. Investment followed next, contributing 4.66 trillion US dollars, which accounts for 17.87% of the GDP, while the government contributed 4.57 trillion US dollars, representing 17.50% of the GDP. Exports contributed 2.98 trillion US dollars, which is 11.43% of the total GDP, and imports contributed 3.84 trillion US dollars, making up 14.71% of the total GDP. ...