Economic Indicators
Connecting numbers, nature, and innovation.

India’s GDP is roughly split between services (49.9%) and the rest, but its standout feature is agriculture: at 16.3% of value-added it is far larger than in any other major economy. That single number captures India’s stage of development — a fast-growing services and industrial economy that still has a very large farm sector. Figures are World Bank value-added shares for 2024; headline nominal GDP was $3.91 trillion. GDP by sector — which industries produce the value Source: World Bank WDI (NV.AGR/IND/SRV.TOTL.ZS), 2024. Value-added as % of GDP, current prices. ...

Canada’s economy reached $2.16 trillion in 2023, the ninth-largest in the world. Services account for 66.4% of value-added — a share comparable to Australia and Germany, driven by finance, real estate, retail, and professional services. Industry contributes 25.3%, notably higher than the US or UK, reflecting Canada’s substantial energy and natural resources sector. GDP by sector — which industries produce the value Source: World Bank WDI (NV.AGR/IND/SRV.TOTL.ZS), 2021. Value-added as % of GDP, current prices. ...

Australia’s economy is services-led — 66.1% of value-added — but carries an unusually large industry sector for a rich country at 25.5%, driven by mining and energy. Agriculture contributes just 2.0% of GDP, though Australia remains one of the world’s biggest food and commodity exporters. Figures are World Bank value-added shares for 2024. GDP by sector — which industries produce the value Source: World Bank WDI (NV.AGR/IND/SRV.TOTL.ZS), 2024. Value-added as % of GDP, current prices. ...
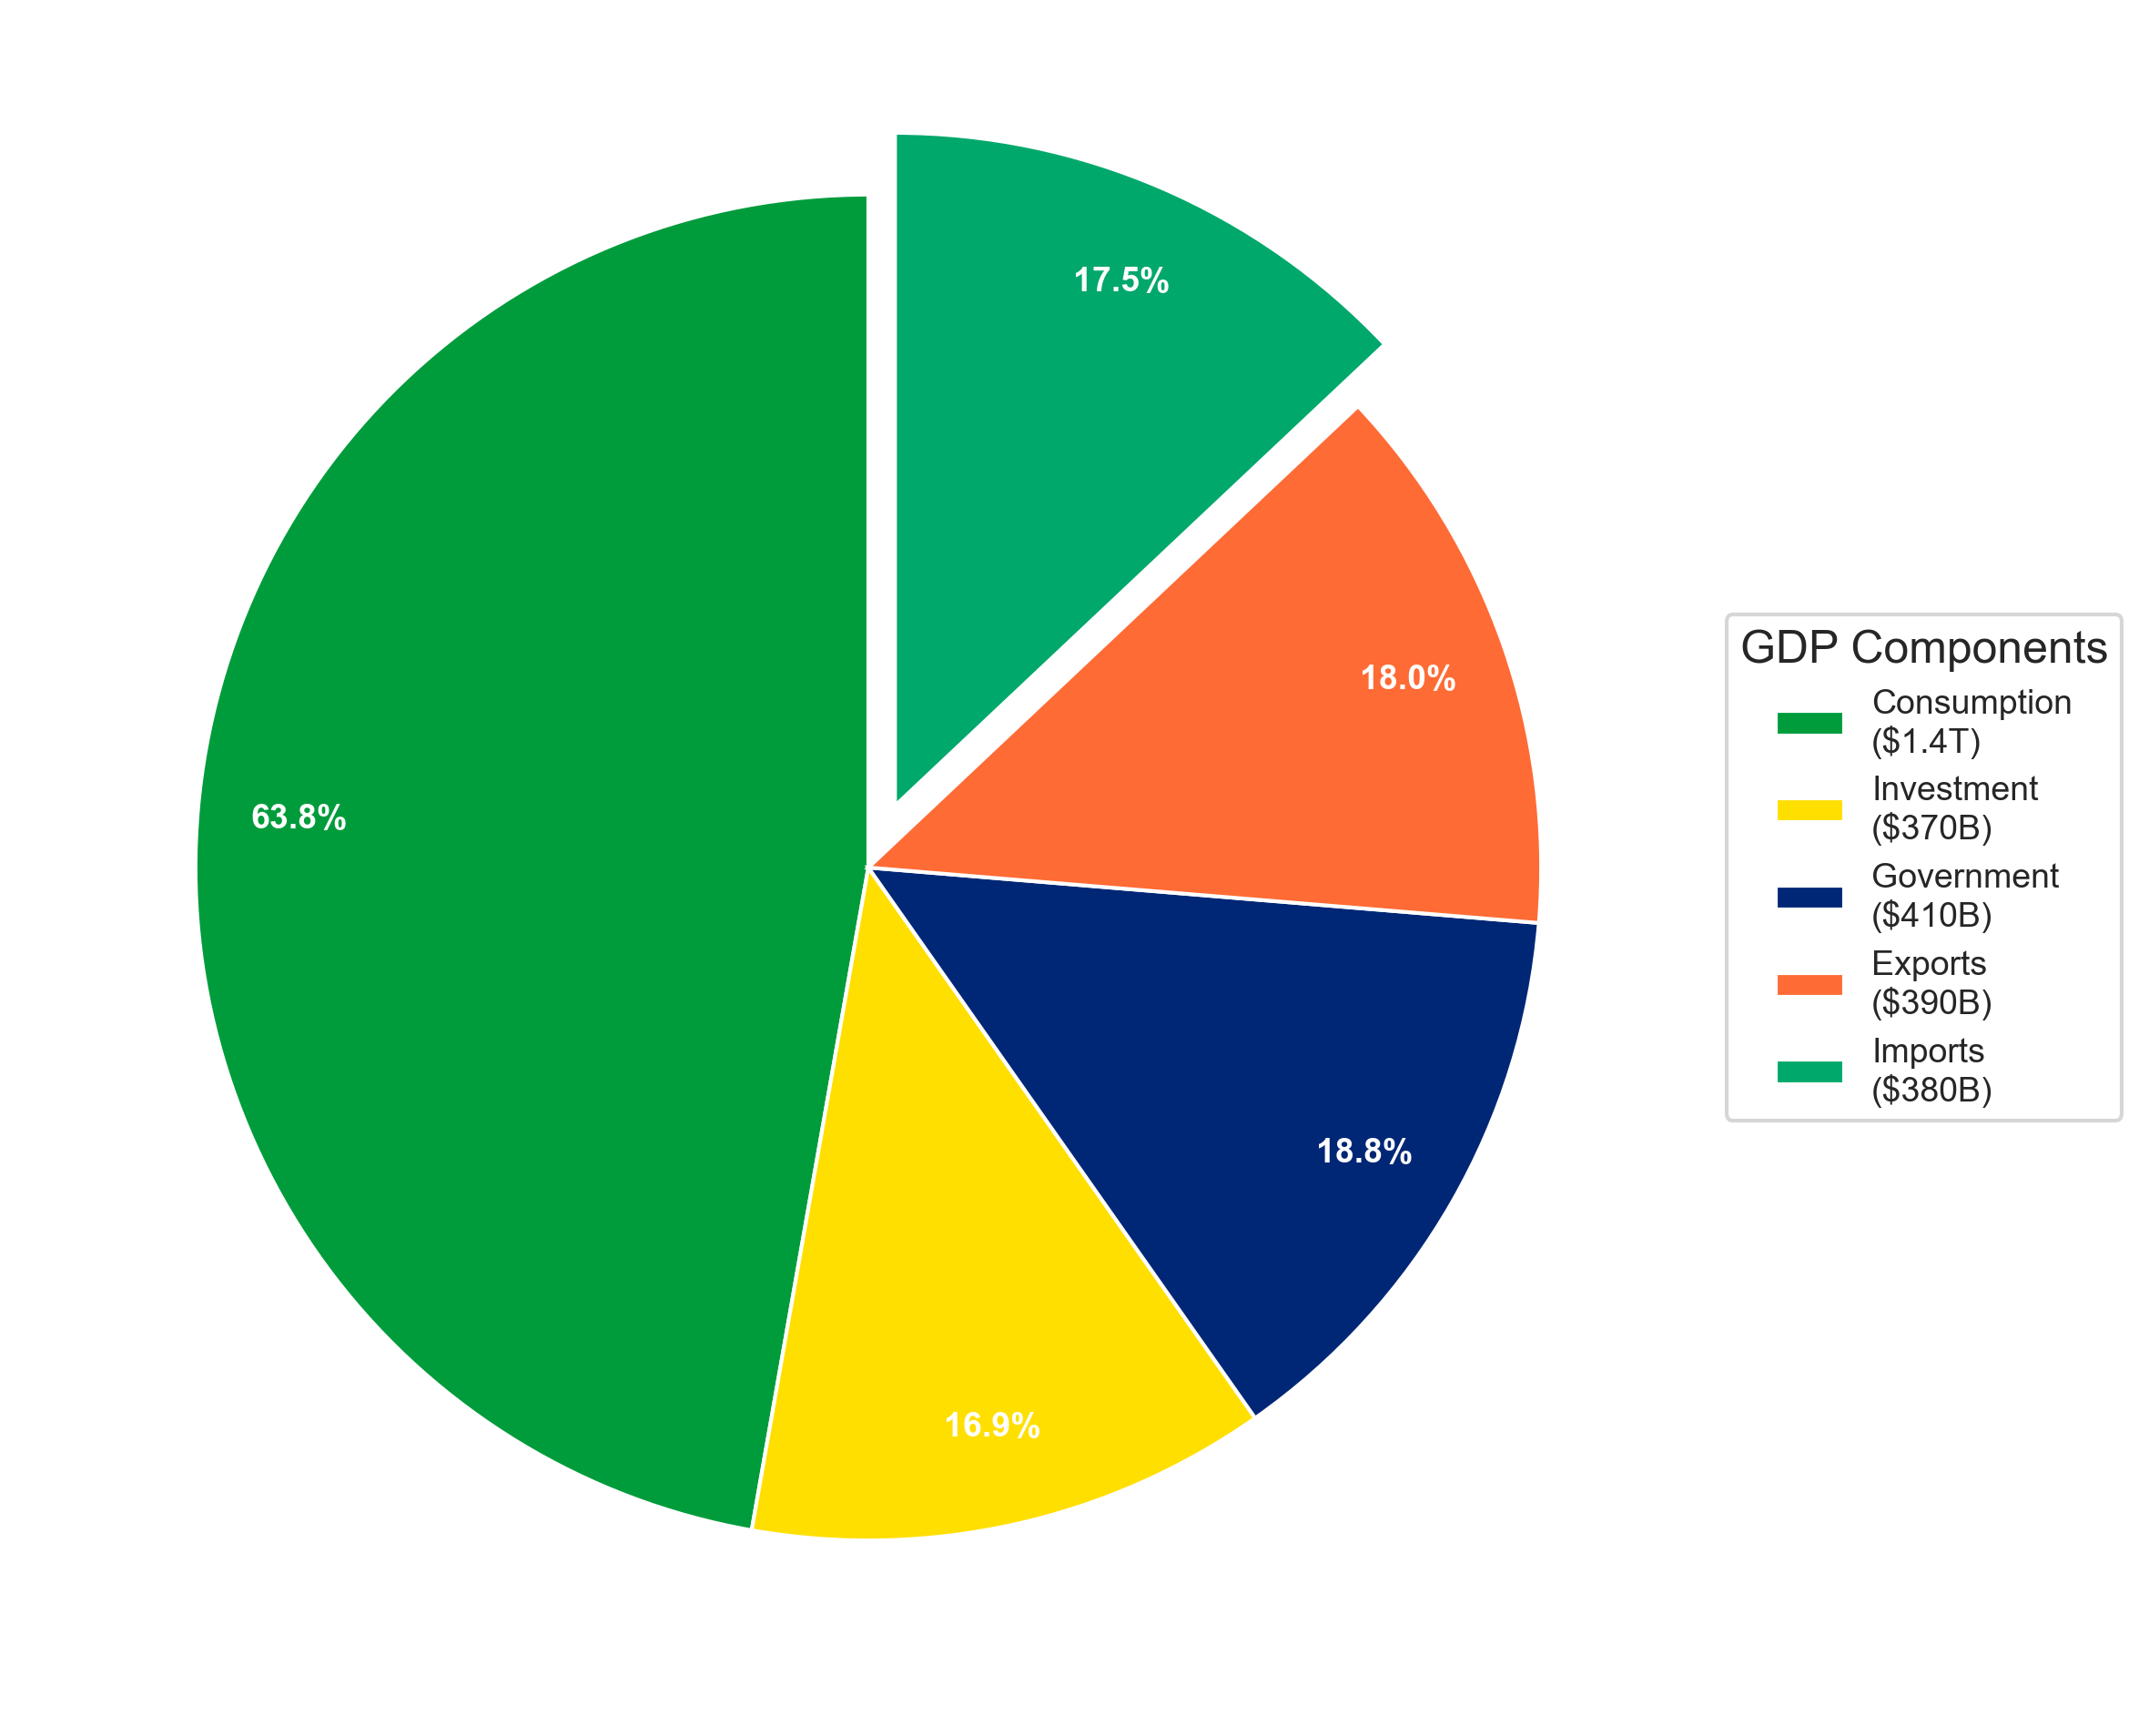
Brazil GDP Pie Chart 2024 Brazil’s GDP composition 2024 pie chart showing emerging economy breakdown. Brazil showed strong domestic market growth with increasing international trade in agriculture, mining, and services sectors. Figure 1: Brazil GDP Composition Breakdown 2024 - Pie Chart Visualization Brazil GDP Components Table 2024 Detailed breakdown of Brazil’s Gross Domestic Product by expenditure components: Component Amount Percentage Pie Chart % Consumption $1.39T 63.8% 47.2% Investment $370B 16.9% 12.5% Government $410B 18.8% 13.9% Exports $390B 18.0% 13.3% Imports $380B -17.5% 13.0% Total GDP $2.18T 100.0% 100.0% Key Economic Insights: Brazil 2024 Primary Economic Driver: Consumption is the largest component of GDP at 63.8% International Trade: Trade surplus with exports at $390B and imports at $380B Investment Level: 16.9% of GDP allocated to capital investment Economic Scale: Total GDP of $2.18T in 2024 Methodology and Data Sources The GDP composition data follows the expenditure approach calculation method and is sourced from World Development Indicators (World Bank). Pie chart percentages are normalized to sum to 100% for clear visual representation. ...

China’s economy reached ¥134.9 trillion (~$18.75T) in 2024, the second-largest in the world. Services now account for 56.7% of value-added — overtaking industry for the first time around 2013 and widening the gap since. Industry remains the second-largest sector at 36.5%, more than double the share seen in most developed economies, reflecting China’s continued role as the world’s dominant manufacturer. GDP by sector — which industries produce the value Source: World Bank WDI (NV.AGR/IND/SRV.TOTL.ZS), 2024. Value-added as % of GDP, current prices. ...
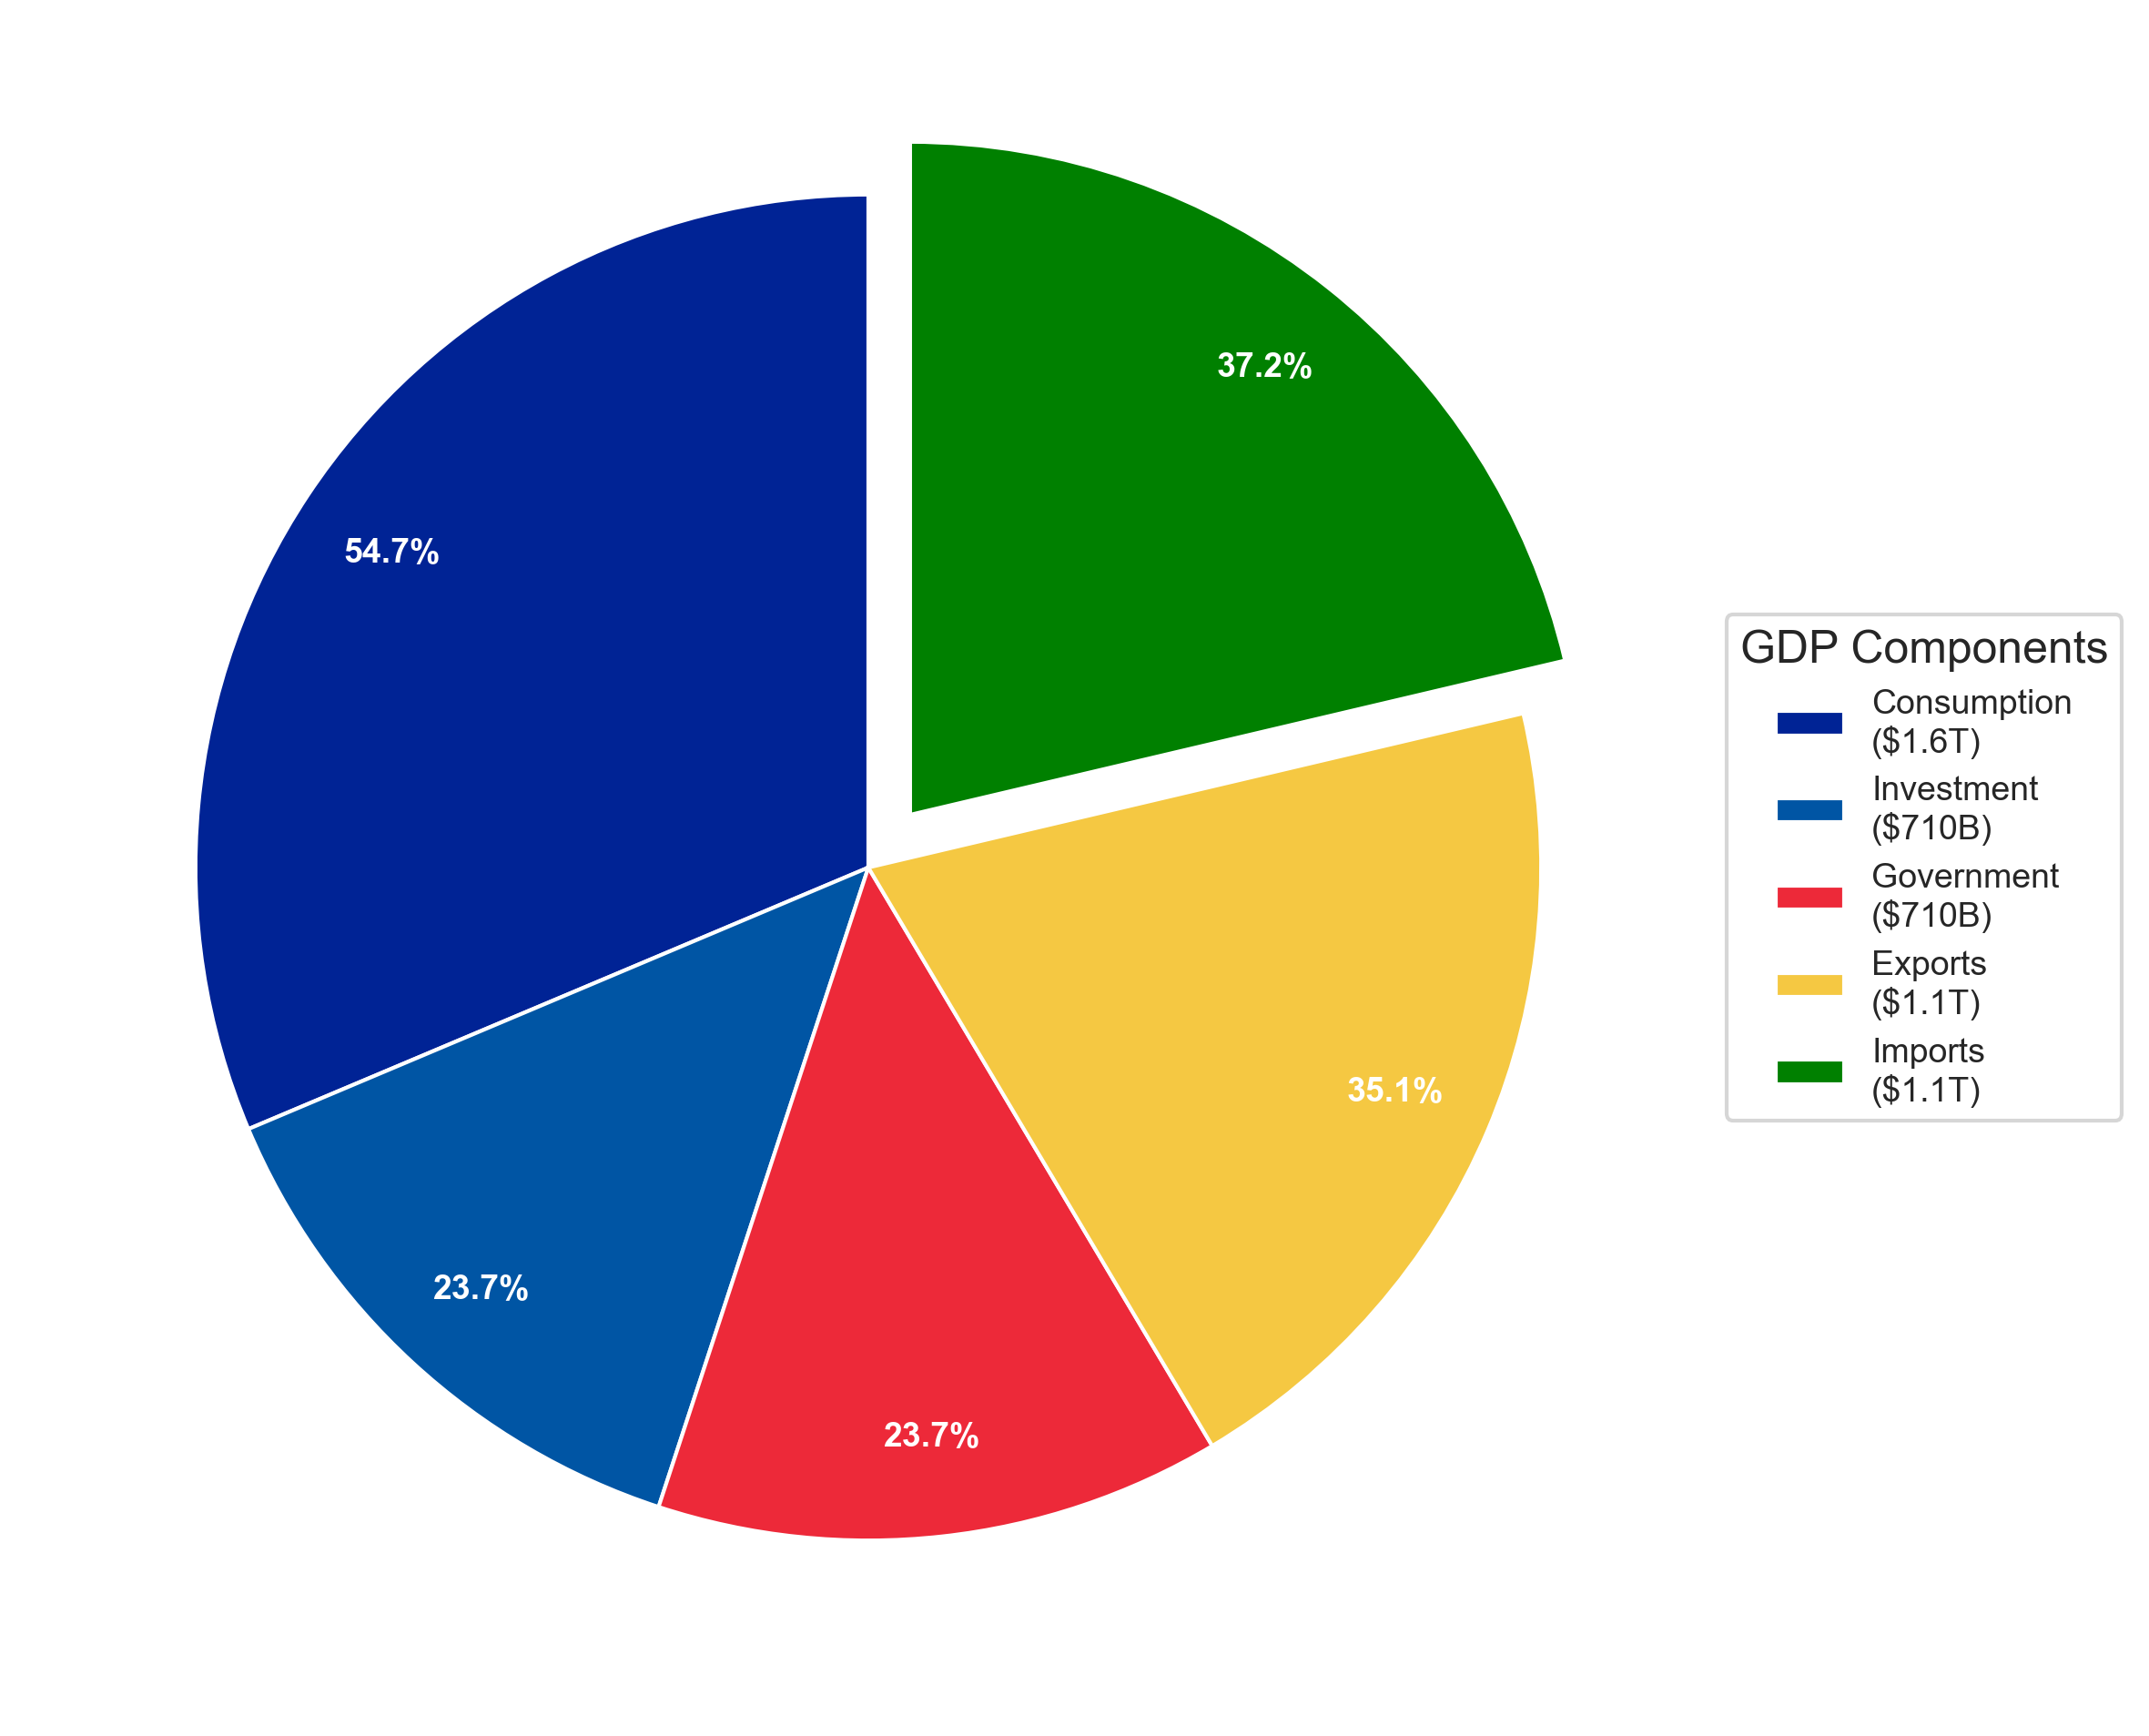
France GDP Pie Chart 2023 France’s GDP composition 2023 pie chart showing diversified economy breakdown. France balanced strong domestic consumption with significant government spending across tourism, aerospace, and luxury goods sectors. Figure 1: France GDP Composition Breakdown 2023 - Pie Chart Visualization France GDP Components Table 2023 Detailed breakdown of France’s Gross Domestic Product by expenditure components: Component Amount Percentage Pie Chart % Consumption $1.63T 54.6% 31.4% Investment $710B 23.7% 13.6% Government $710B 23.7% 13.6% Exports $1.05T 35.1% 20.1% Imports $1.11T -37.2% 21.3% Total GDP $2.98T 100.0% 100.0% Key Economic Insights: France 2023 Primary Economic Driver: Consumption is the largest component of GDP at 54.6% International Trade: Trade deficit with exports at $1.05T and imports at $1.11T Investment Level: 23.7% of GDP allocated to capital investment Economic Scale: Total GDP of $2.98T in 2023 Methodology and Data Sources The GDP composition data follows the expenditure approach calculation method and is sourced from World Development Indicators (World Bank). Pie chart percentages are normalized to sum to 100% for clear visual representation. ...
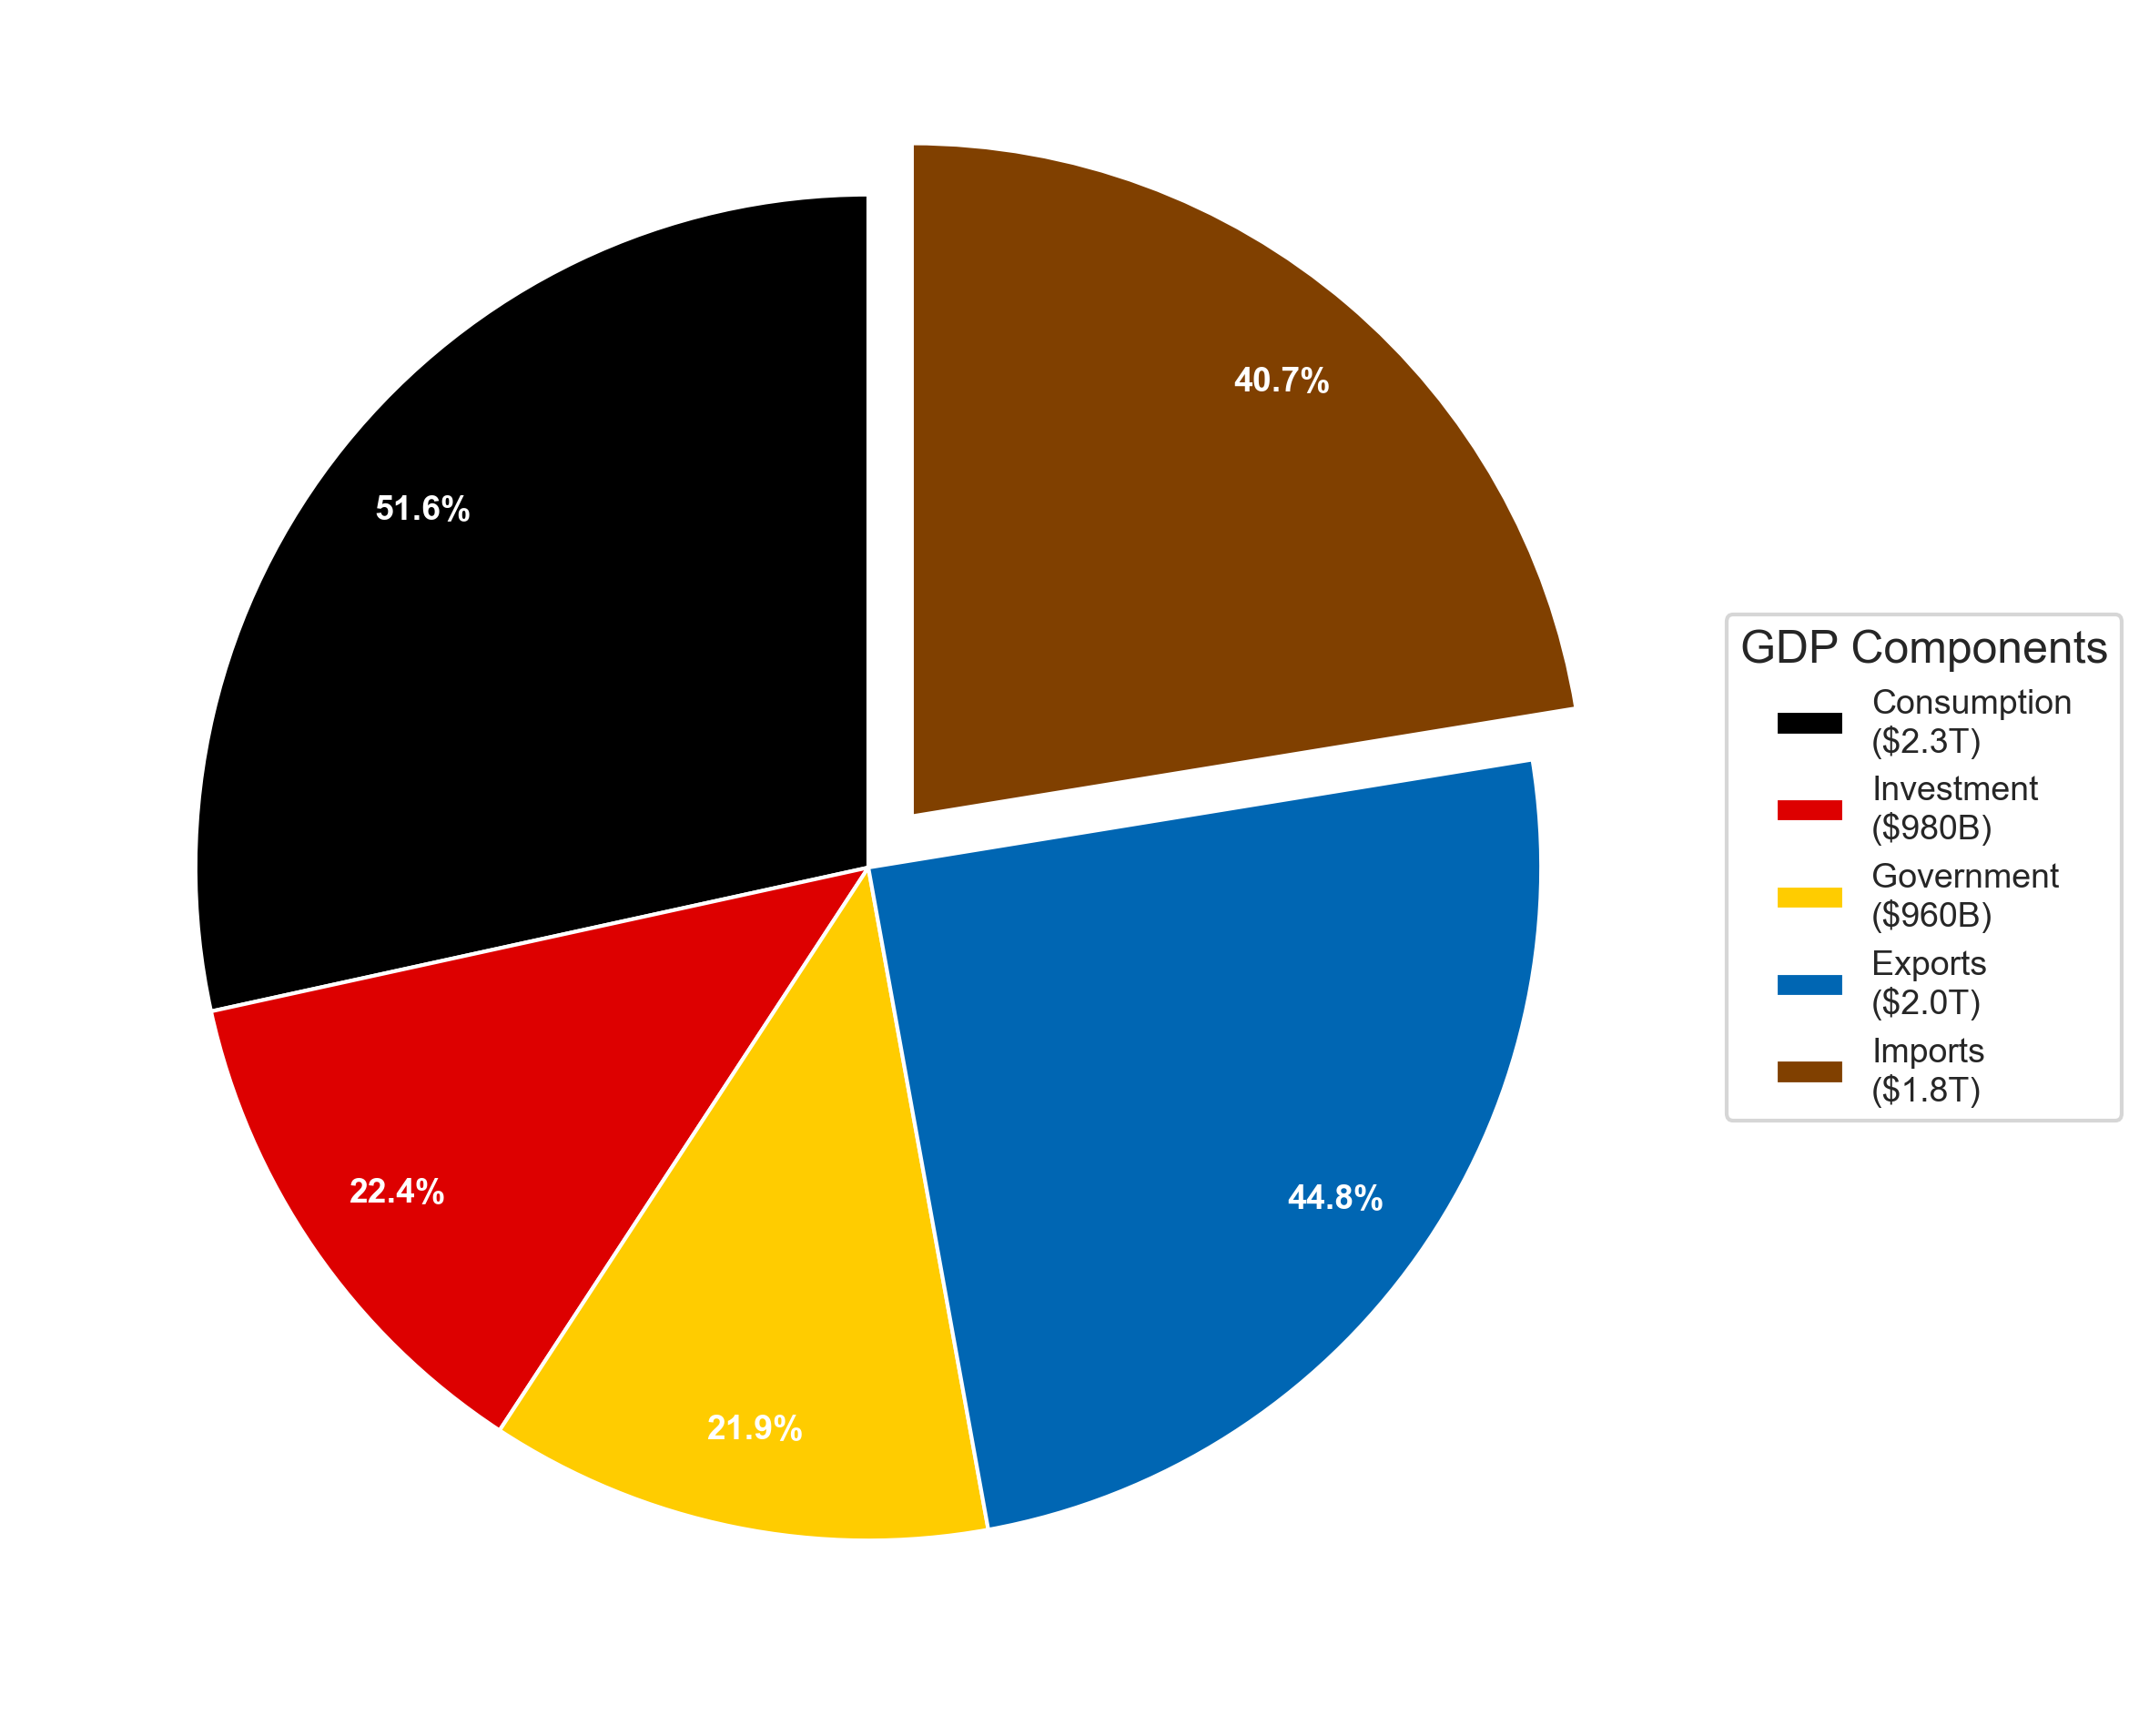
Germany GDP Pie Chart 2023 Germany’s GDP composition 2023 pie chart showing export-oriented economy breakdown. Germany maintained its position as Europe’s economic powerhouse with strong manufacturing and engineering exports. Figure 1: Germany GDP Composition Breakdown 2023 - Pie Chart Visualization Germany GDP Components Table 2023 Detailed breakdown of Germany’s Gross Domestic Product by expenditure components: Component Amount Percentage Pie Chart % Consumption $2.26T 51.6% 28.4% Investment $980B 22.4% 12.3% Government $960B 21.9% 12.1% Exports $1.96T 44.8% 24.7% Imports $1.78T -40.7% 22.4% Total GDP $4.38T 100.0% 100.0% Key Economic Insights: Germany 2023 Primary Economic Driver: Consumption is the largest component of GDP at 51.6% International Trade: Trade surplus with exports at $1.96T and imports at $1.78T Investment Level: 22.4% of GDP allocated to capital investment Economic Scale: Total GDP of $4.38T in 2023 Methodology and Data Sources The GDP composition data follows the expenditure approach calculation method and is sourced from World Development Indicators (World Bank). Pie chart percentages are normalized to sum to 100% for clear visual representation. ...

Japan’s economy reached $4.21 trillion in 2023, the fourth-largest in the world. Services account for 69.8% of value-added, driven by wholesale and retail trade, finance, real estate, and a large healthcare sector serving one of the world’s oldest populations. Industry contributes 28.6% — significantly higher than the US or UK, reflecting Japan’s deep manufacturing base in automotive, electronics, and industrial machinery. GDP by sector — which industries produce the value Source: World Bank WDI (NV.AGR/IND/SRV.TOTL.ZS), 2023. Value-added as % of GDP, current prices. ...

Singapore is one of the world’s most open economies, with GDP reaching SGD 766 billion in 2024. Services account for 73.0% of value-added, driven by finance, trade-related services, and logistics. Industry contributes 21.4% — deliberately high for a financial centre, anchored by precision manufacturing in semiconductors, pharmaceuticals, and petrochemicals on Jurong Island. GDP by sector — which industries produce the value Source: World Bank WDI (NV.AGR/IND/SRV.TOTL.ZS), 2024. Value-added as % of GDP, current prices. ...

The UK generated roughly $3.3 trillion in GDP in 2023, making it the sixth-largest economy in the world. Services account for 72.4% of value-added — one of the highest shares among the G7 — reflecting four decades of structural shift away from manufacturing toward finance, professional services, and the creative industries. Industry has fallen from 27.6% in 1990 to 17.1% in 2024 as a result. GDP by sector — which industries produce the value Source: World Bank WDI (NV.AGR/IND/SRV.TOTL.ZS), 2024. Value-added as % of GDP, current prices. ...