France GDP Composition 2023 - Pie Chart & Components Breakdown
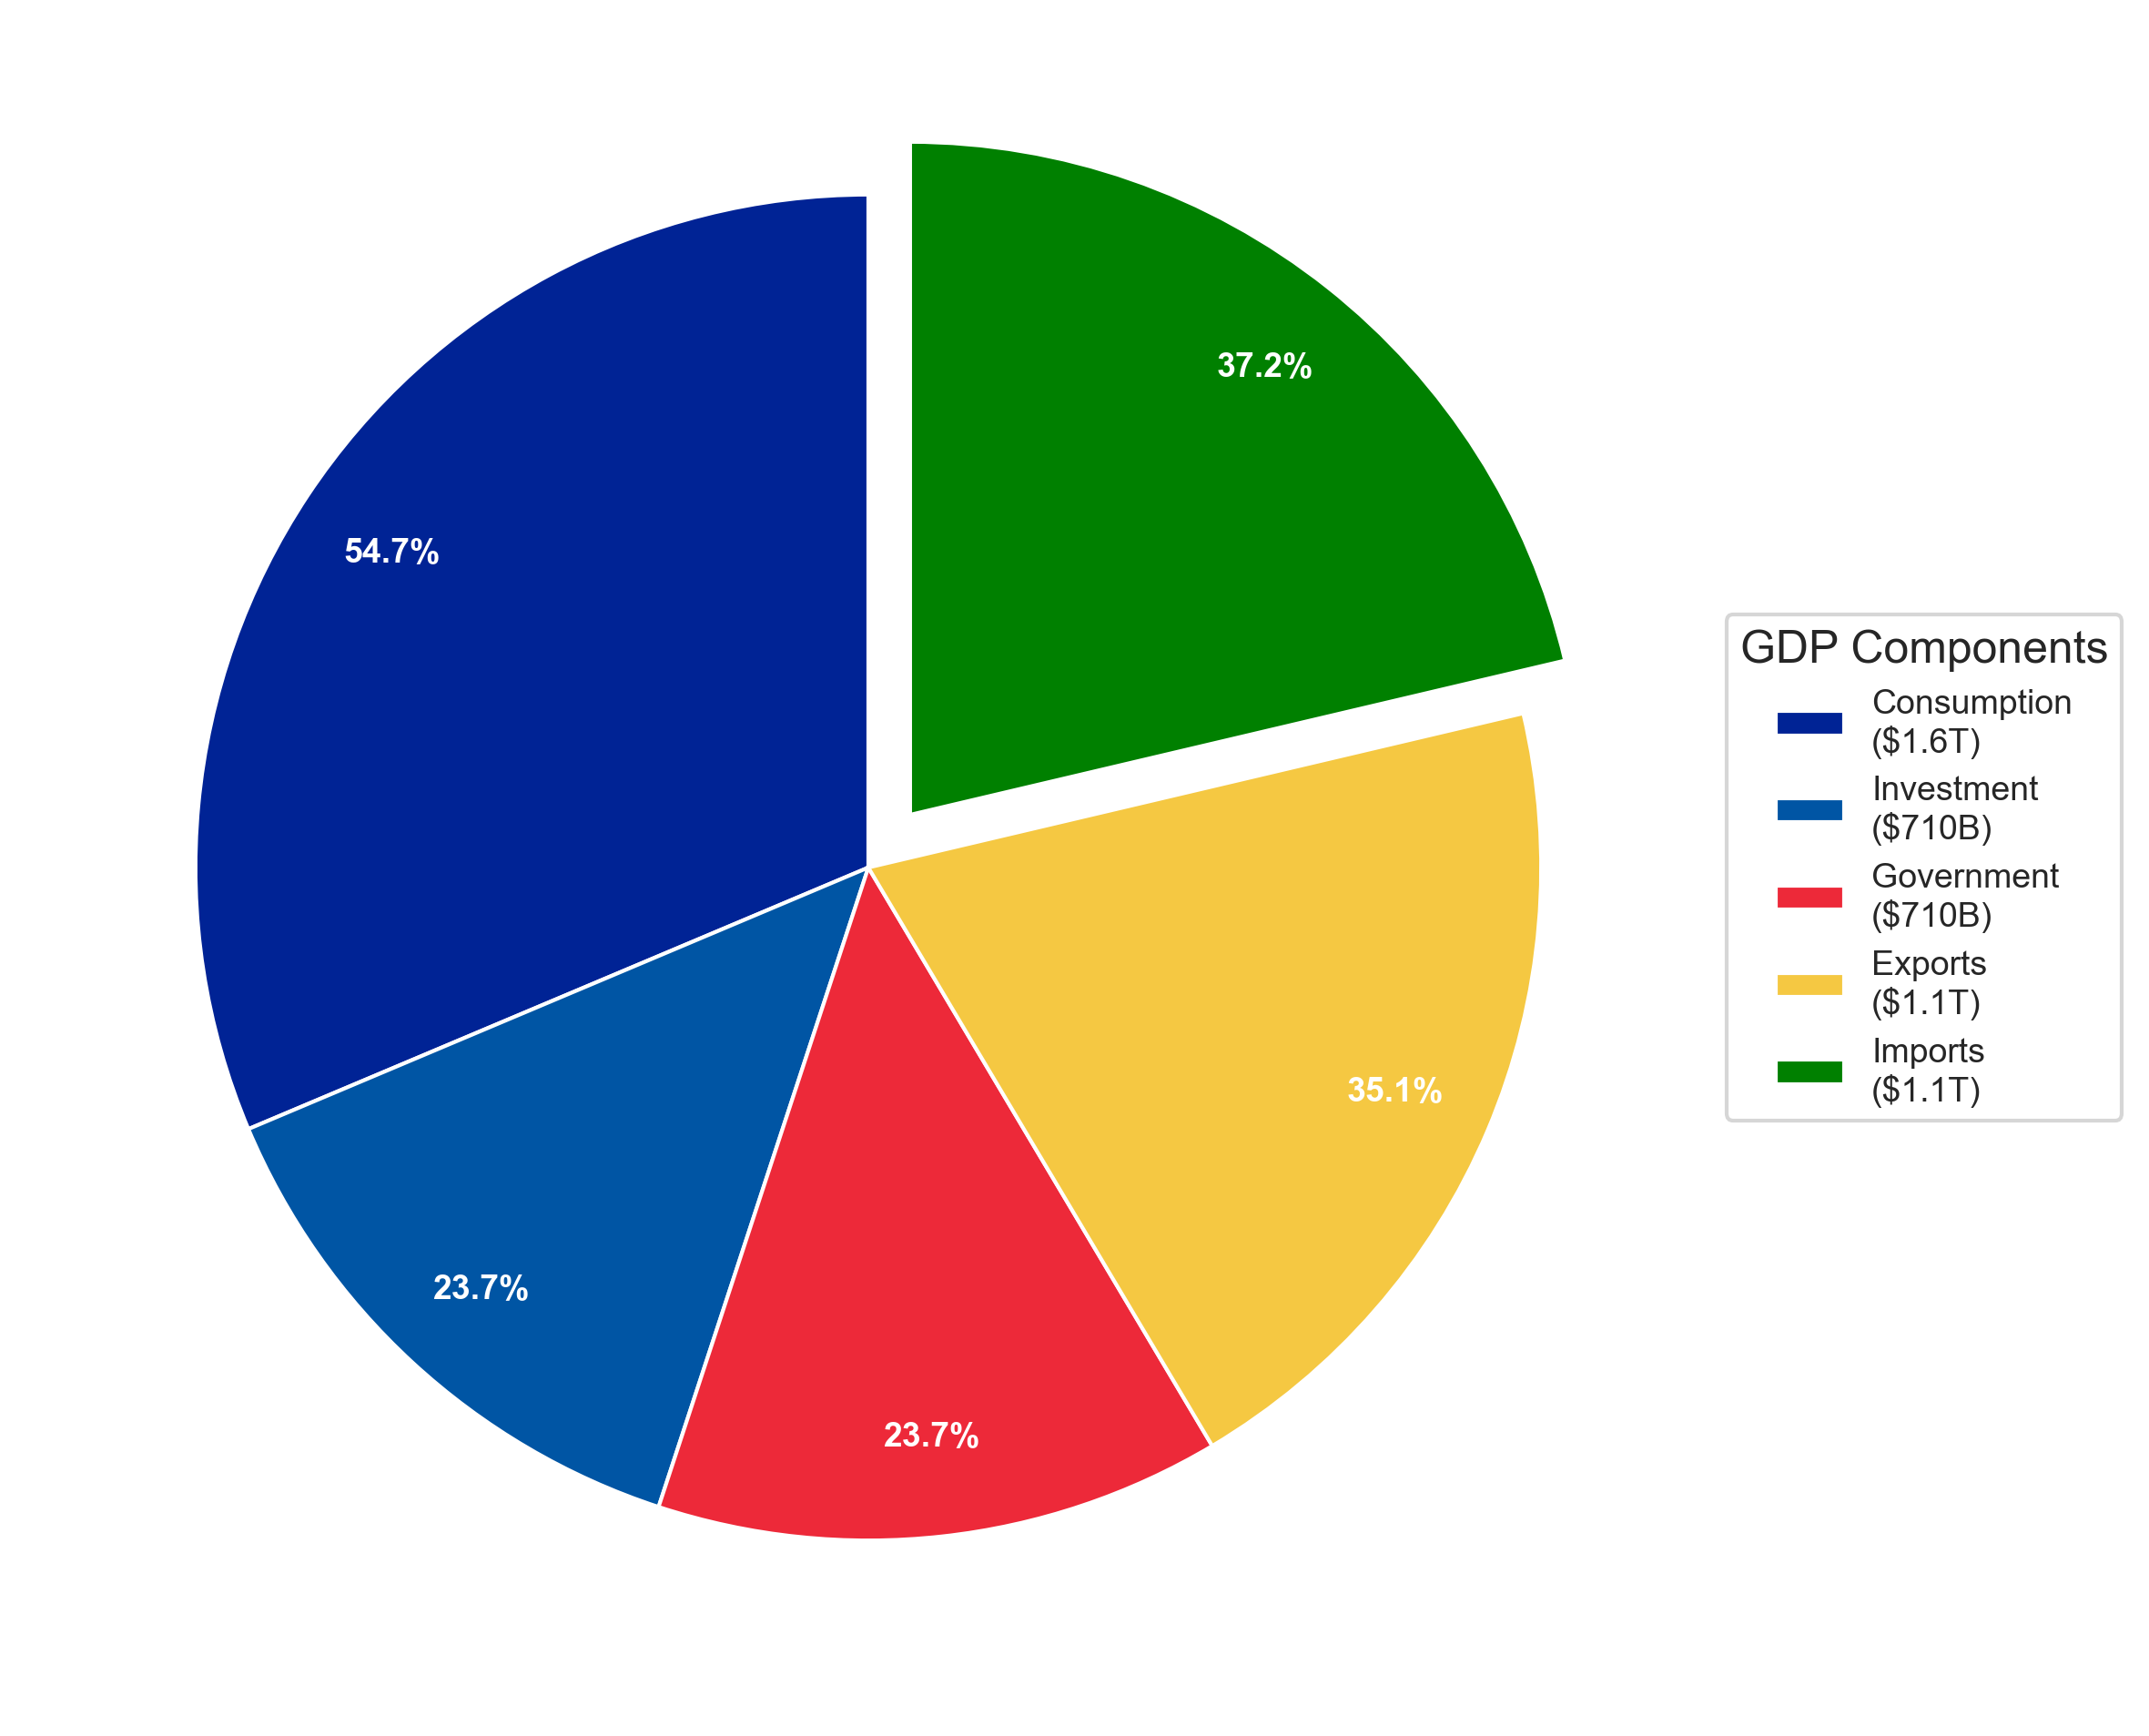
France GDP Pie Chart 2023 France’s GDP composition 2023 pie chart showing diversified economy breakdown. France balanced strong domestic consumption with significant government spending across tourism, aerospace, and luxury goods sectors. Figure 1: France GDP Composition Breakdown 2023 - Pie Chart Visualization France GDP Components Table 2023 Detailed breakdown of France’s Gross Domestic Product by expenditure components: Component Amount Percentage Pie Chart % Consumption $1.63T 54.6% 31.4% Investment $710B 23.7% 13.6% Government $710B 23.7% 13.6% Exports $1.05T 35.1% 20.1% Imports $1.11T -37.2% 21.3% Total GDP $2.98T 100.0% 100.0% Key Economic Insights: France 2023 Primary Economic Driver: Consumption is the largest component of GDP at 54.6% International Trade: Trade deficit with exports at $1.05T and imports at $1.11T Investment Level: 23.7% of GDP allocated to capital investment Economic Scale: Total GDP of $2.98T in 2023 Methodology and Data Sources The GDP composition data follows the expenditure approach calculation method and is sourced from World Development Indicators (World Bank). Pie chart percentages are normalized to sum to 100% for clear visual representation. ...
