Germany GDP Composition 2023 - Pie Chart & Components Breakdown
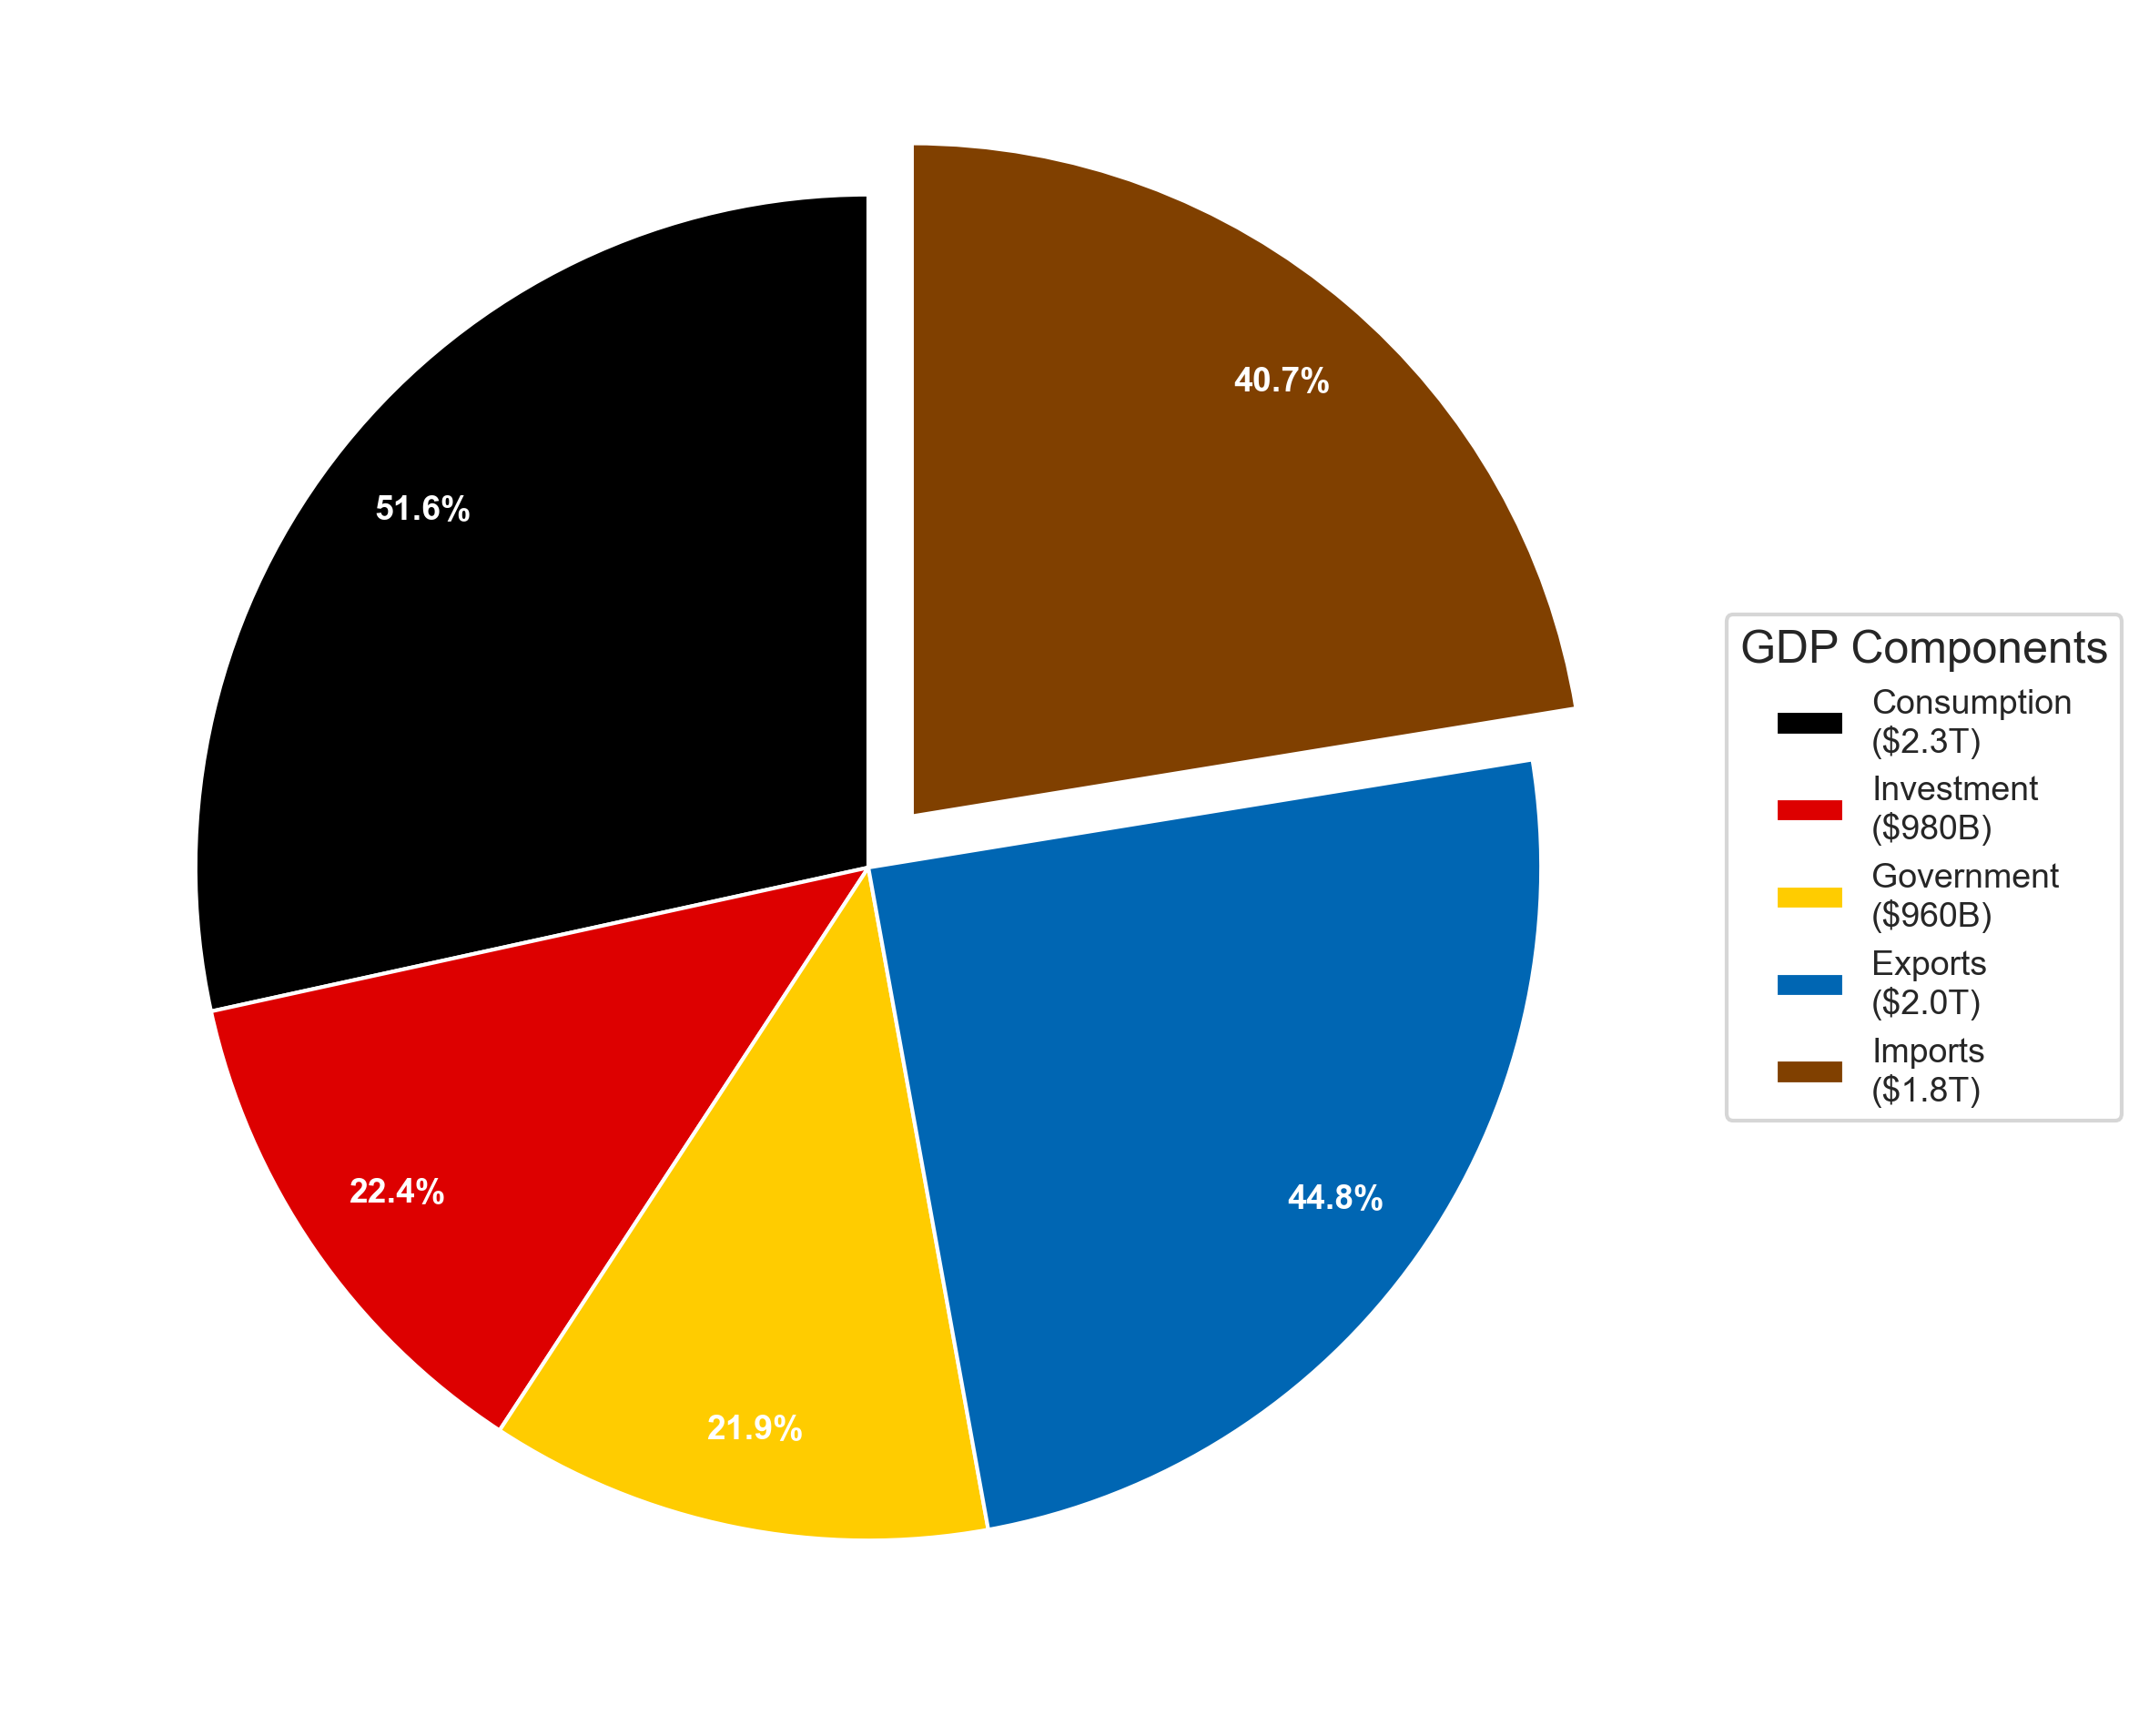
Germany GDP Pie Chart 2023 Germany’s GDP composition 2023 pie chart showing export-oriented economy breakdown. Germany maintained its position as Europe’s economic powerhouse with strong manufacturing and engineering exports. Figure 1: Germany GDP Composition Breakdown 2023 - Pie Chart Visualization Germany GDP Components Table 2023 Detailed breakdown of Germany’s Gross Domestic Product by expenditure components: Component Amount Percentage Pie Chart % Consumption $2.26T 51.6% 28.4% Investment $980B 22.4% 12.3% Government $960B 21.9% 12.1% Exports $1.96T 44.8% 24.7% Imports $1.78T -40.7% 22.4% Total GDP $4.38T 100.0% 100.0% Key Economic Insights: Germany 2023 Primary Economic Driver: Consumption is the largest component of GDP at 51.6% International Trade: Trade surplus with exports at $1.96T and imports at $1.78T Investment Level: 22.4% of GDP allocated to capital investment Economic Scale: Total GDP of $4.38T in 2023 Methodology and Data Sources The GDP composition data follows the expenditure approach calculation method and is sourced from World Development Indicators (World Bank). Pie chart percentages are normalized to sum to 100% for clear visual representation. ...