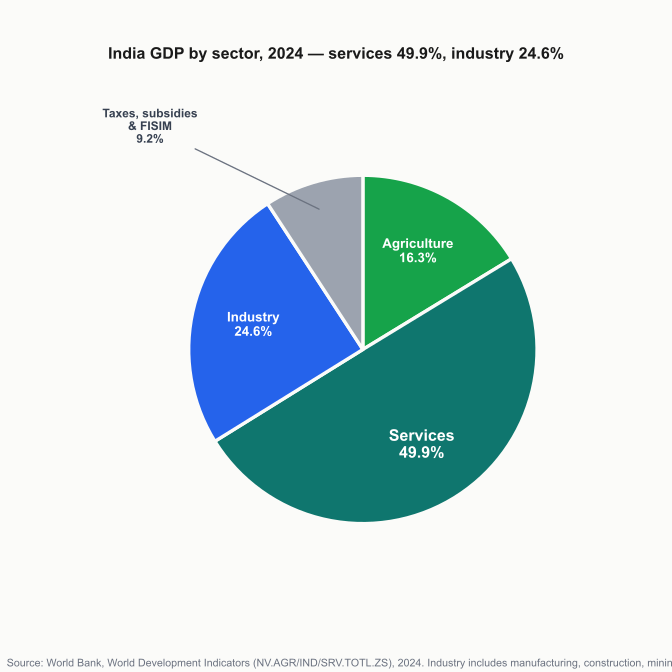
Pie chart: India GDP by sector 2024 — services 49.9%, industry 24.6%, agriculture 16.3%

India GDP by Sector 2024 — Services 49.9%, Industry 24.6%, Agriculture 16.3%

India’s GDP is roughly split between services (49.9%) and the rest, but its standout feature is agriculture: at 16.3% of value-added it is far larger than in any other major economy. That single number captures India’s stage of development — a fast-growing services and industrial economy that still has a very large farm sector. Figures are World Bank value-added shares for 2024; headline nominal GDP was $3.91 trillion. GDP by sector — which industries produce the value Source: World Bank WDI (NV.AGR/IND/SRV.TOTL.ZS), 2024. Value-added as % of GDP, current prices. ...
October 27, 2025 · 4 min
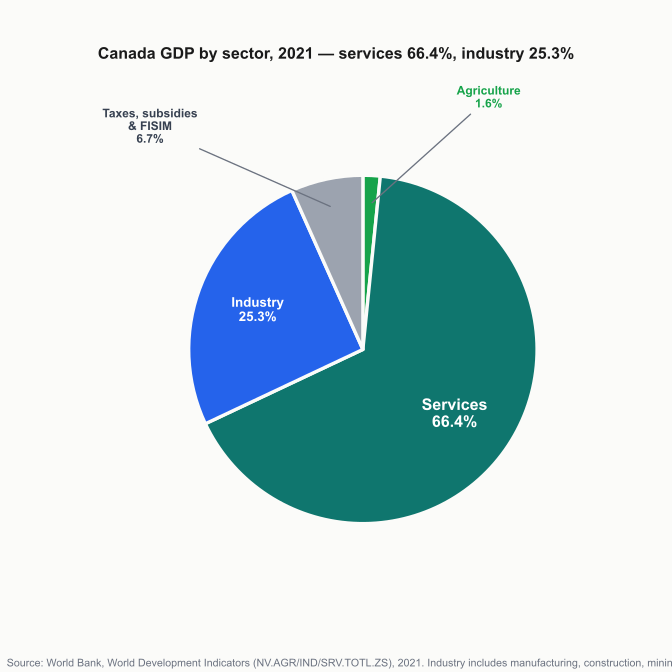
Pie chart: Canada GDP by sector 2021 — services 66.4%, industry 25.3%, agriculture 1.6%

Canada GDP by Sector 2021 — Services 66.4%, Industry 25.3%

Canada’s economy reached $2.16 trillion in 2023, the ninth-largest in the world. Services account for 66.4% of value-added — a share comparable to Australia and Germany, driven by finance, real estate, retail, and professional services. Industry contributes 25.3%, notably higher than the US or UK, reflecting Canada’s substantial energy and natural resources sector. GDP by sector — which industries produce the value Source: World Bank WDI (NV.AGR/IND/SRV.TOTL.ZS), 2021. Value-added as % of GDP, current prices. ...

October 31, 2025 · 3 min
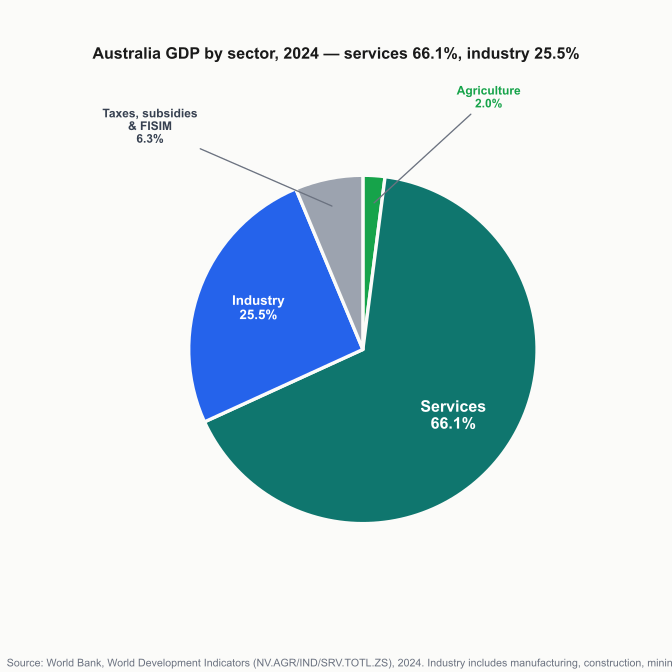
Pie chart: Australia GDP by sector 2024 — services 66.1%, industry 25.5%, agriculture 2.0%

Australia GDP by Sector 2024 — Services 66.1%, Industry 25.5%

Australia’s economy is services-led — 66.1% of value-added — but carries an unusually large industry sector for a rich country at 25.5%, driven by mining and energy. Agriculture contributes just 2.0% of GDP, though Australia remains one of the world’s biggest food and commodity exporters. Figures are World Bank value-added shares for 2024. GDP by sector — which industries produce the value Source: World Bank WDI (NV.AGR/IND/SRV.TOTL.ZS), 2024. Value-added as % of GDP, current prices. ...
October 31, 2025 · 3 min
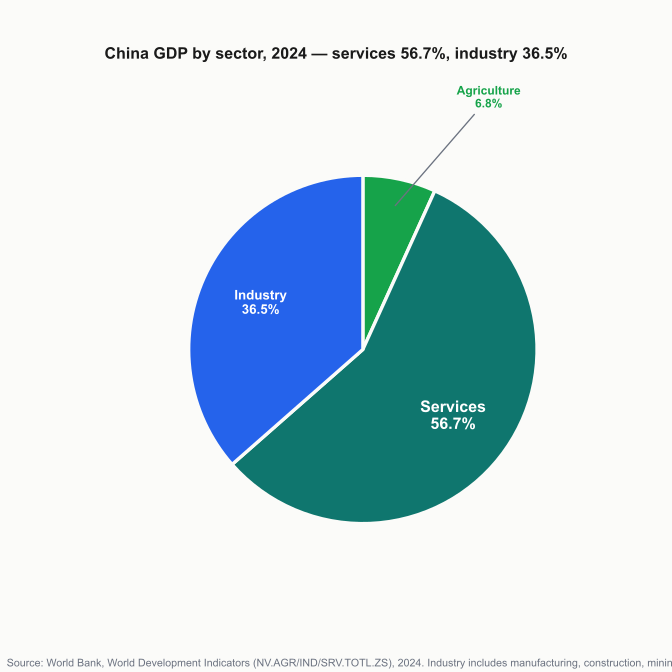
Pie chart: China GDP by sector 2024 — services 56.7%, industry 36.5%, agriculture 6.8%

China GDP by Sector 2024 — Services 56.7%, Industry 36.5%

China’s economy reached ¥134.9 trillion (~$18.75T) in 2024, the second-largest in the world. Services now account for 56.7% of value-added — overtaking industry for the first time around 2013 and widening the gap since. Industry remains the second-largest sector at 36.5%, more than double the share seen in most developed economies, reflecting China’s continued role as the world’s dominant manufacturer. GDP by sector — which industries produce the value Source: World Bank WDI (NV.AGR/IND/SRV.TOTL.ZS), 2024. Value-added as % of GDP, current prices. ...
October 27, 2025 · 2 min
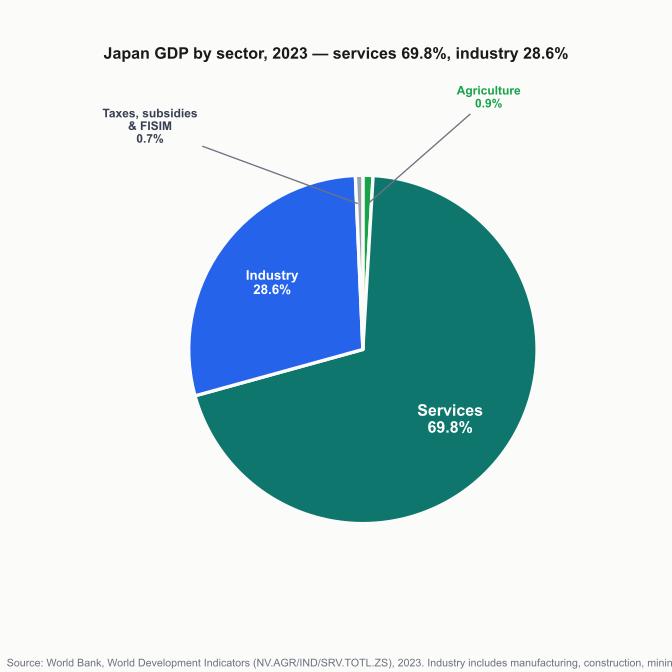
Pie chart: Japan GDP by sector 2023 — services 69.8%, industry 28.6%, agriculture 0.9%

Japan GDP by Sector 2023 — Services 69.8%, Industry 28.6%

Japan’s economy reached $4.21 trillion in 2023, the fourth-largest in the world. Services account for 69.8% of value-added, driven by wholesale and retail trade, finance, real estate, and a large healthcare sector serving one of the world’s oldest populations. Industry contributes 28.6% — significantly higher than the US or UK, reflecting Japan’s deep manufacturing base in automotive, electronics, and industrial machinery. GDP by sector — which industries produce the value Source: World Bank WDI (NV.AGR/IND/SRV.TOTL.ZS), 2023. Value-added as % of GDP, current prices. ...

October 27, 2025 · 3 min
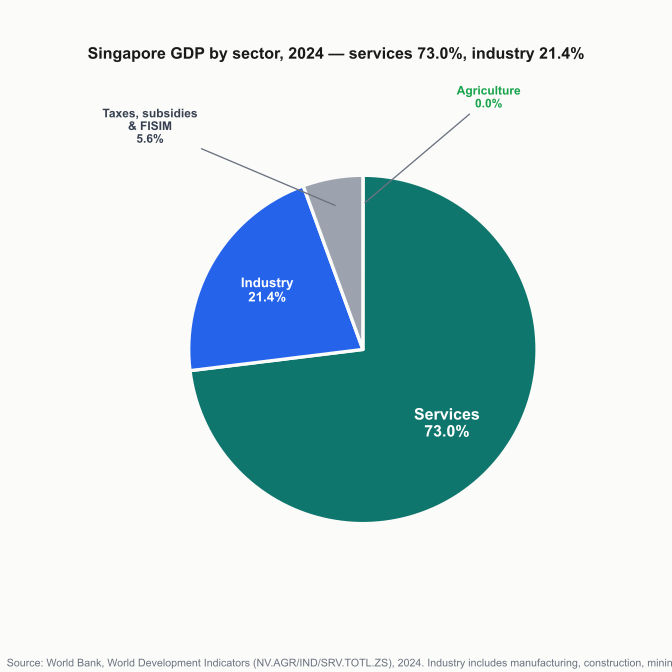
Pie chart: Singapore GDP by sector 2024 — services 73.0%, industry 21.4%

Singapore GDP by Sector 2024 — Services 73.0%, Industry 21.4%

Singapore is one of the world’s most open economies, with GDP reaching SGD 766 billion in 2024. Services account for 73.0% of value-added, driven by finance, trade-related services, and logistics. Industry contributes 21.4% — deliberately high for a financial centre, anchored by precision manufacturing in semiconductors, pharmaceuticals, and petrochemicals on Jurong Island. GDP by sector — which industries produce the value Source: World Bank WDI (NV.AGR/IND/SRV.TOTL.ZS), 2024. Value-added as % of GDP, current prices. ...
October 27, 2025 · 4 min
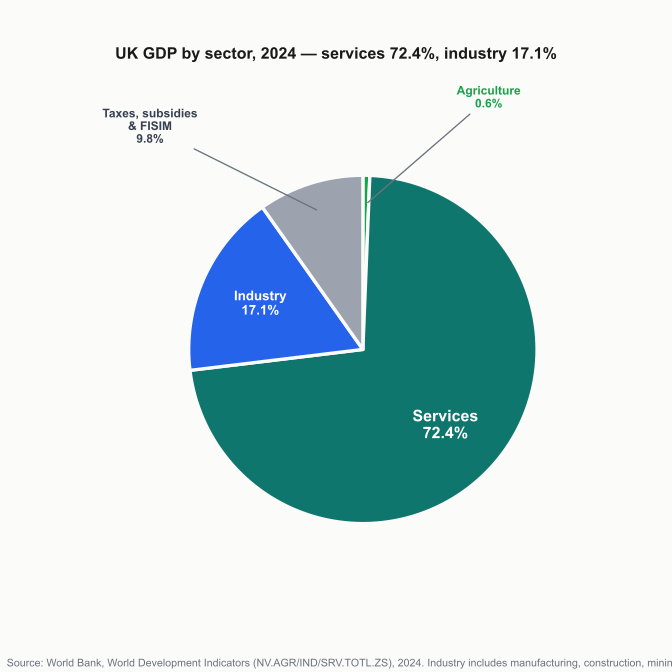
Pie chart: UK GDP by sector 2024 — services 72.4%, industry 17.1%, agriculture 0.6%, residual 9.8%

UK GDP by Sector (2024): Services 72%, Industry 17%, Agriculture 1%

The UK generated roughly $3.3 trillion in GDP in 2023, making it the sixth-largest economy in the world. Services account for 72.4% of value-added — one of the highest shares among the G7 — reflecting four decades of structural shift away from manufacturing toward finance, professional services, and the creative industries. Industry has fallen from 27.6% in 1990 to 17.1% in 2024 as a result. GDP by sector — which industries produce the value Source: World Bank WDI (NV.AGR/IND/SRV.TOTL.ZS), 2024. Value-added as % of GDP, current prices. ...
October 27, 2025 · 3 min