Japan GDP Pie Chart 2023
Japan’s GDP composition 2023 pie chart showing mature economy breakdown. Japan continued to be driven by domestic consumption and technological exports as a global innovation leader.
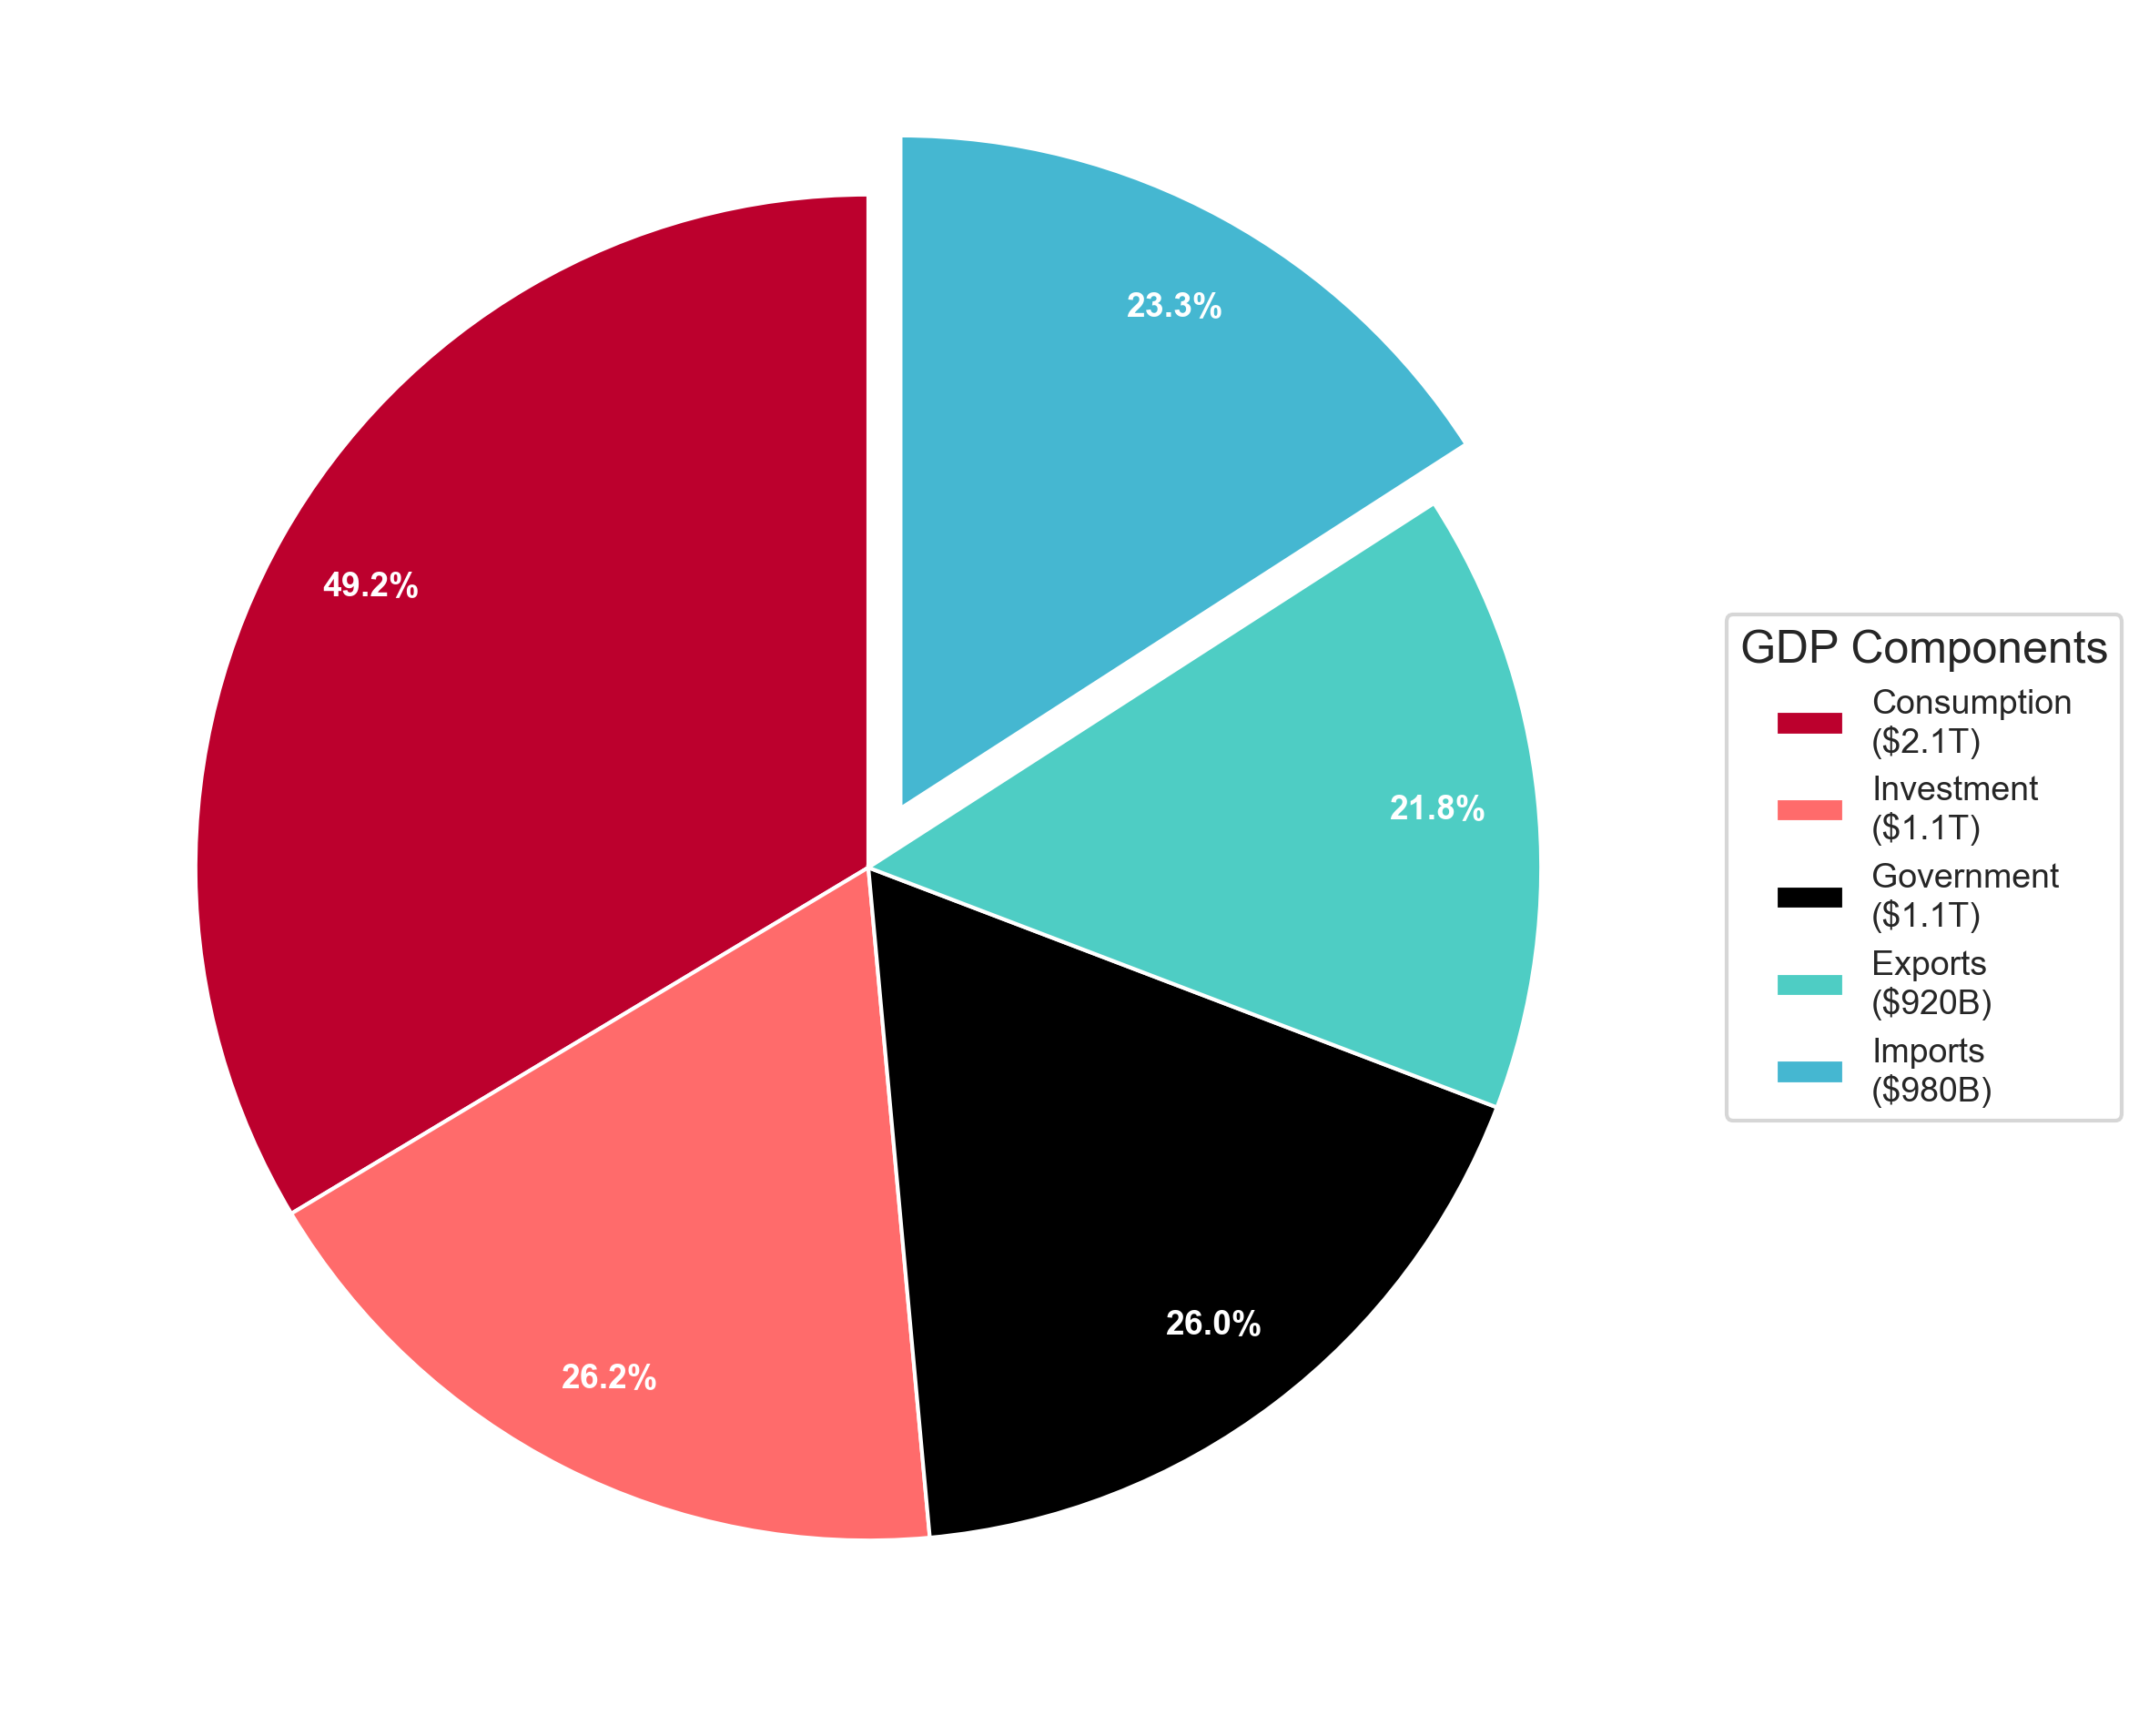
Figure 1: Japan GDP Composition Breakdown 2023 - Pie Chart Visualization
Japan GDP Components Table 2023
Detailed breakdown of Japan’s Gross Domestic Product by expenditure components:
| Component | Amount | Percentage | Pie Chart % |
|---|---|---|---|
| Consumption | $2.08T | 49.2% | 33.6% |
| Investment | $1.10T | 26.2% | 17.9% |
| Government | $1.10T | 26.0% | 17.7% |
| Exports | $920B | 21.9% | 14.9% |
| Imports | $980B | -23.3% | 15.9% |
| Total GDP | $4.21T | 100.0% | 100.0% |
Key Economic Insights: Japan 2023
- Primary Economic Driver: Consumption is the largest component of GDP at 49.2%
- International Trade: Trade deficit with exports at $920B and imports at $980B
- Investment Level: 26.2% of GDP allocated to capital investment
- Economic Scale: Total GDP of $4.21T in 2023
Understanding Japan’s GDP Composition
This japan GDP pie chart visualization breaks down the four main components of Gross Domestic Product:
- Consumption - Household and consumer spending
- Investment - Business capital expenditure and investments
- Government - Public sector spending and services
- Net Exports - Exports minus imports of goods and services
Methodology and Data Sources
The GDP composition data follows the expenditure approach calculation method and is sourced from World Development Indicators (World Bank). Pie chart percentages are normalized to sum to 100% for clear visual representation.
Note: Due to statistical discrepancies in data collection and rounding, the sum of individual components may not exactly equal the total GDP. Data represents the most recent available figures for 2023.