The UK generated roughly $3.3 trillion in GDP in 2023, making it the sixth-largest economy in the world. Services account for 72.4% of value-added — one of the highest shares among the G7 — reflecting four decades of structural shift away from manufacturing toward finance, professional services, and the creative industries. Industry has fallen from 27.6% in 1990 to 17.1% in 2024 as a result.
GDP by sector — which industries produce the value

Source: World Bank WDI (NV.AGR/IND/SRV.TOTL.ZS), 2024. Value-added as % of GDP, current prices.
| Sector | Share of GDP | What it includes |
|---|---|---|
| Services | 72.4% | Finance, real estate, retail, transport, education, health, public administration |
| Industry | 17.1% | Manufacturing, construction, mining, utilities |
| Agriculture | 0.6% | Farming, forestry, fishing |
| Taxes, subsidies & FISIM¹ | 9.8% | National accounts adjustment (not a sector) |
| Total | 100% |
¹ Sector values are published exactly as the World Bank reports them. The residual (taxes less subsidies on products + FISIM) makes the chart sum to 100 without altering any sector figure. For the UK, FISIM is elevated because London’s financial sector generates large volumes of financial intermediation services measured indirectly.
What the numbers say
The UK is one of the most service-dominated economies in the G7. London’s position as a global financial centre — home to one of the world’s largest foreign exchange and derivatives markets — means finance and insurance alone account for a disproportionately large share of services output. The high residual (9.8% vs a typical 2–6% for most economies) reflects this: FISIM, which captures the value of bank intermediation, is structurally larger when financial services are a bigger part of the economy. Industry’s steady decline from 27.6% in 1990 mirrors the broader deindustrialisation seen across rich economies, but the UK’s fall has been steeper than Germany’s or Japan’s. Agriculture at 0.6% is among the smallest shares in the developed world — highly productive per worker but a tiny slice of a large economy.
GDP by expenditure — who spends it
The sector chart above and the expenditure table below measure different things. Sector = which industries produce the value; expenditure = who spends it. Both are correct; they answer different questions.
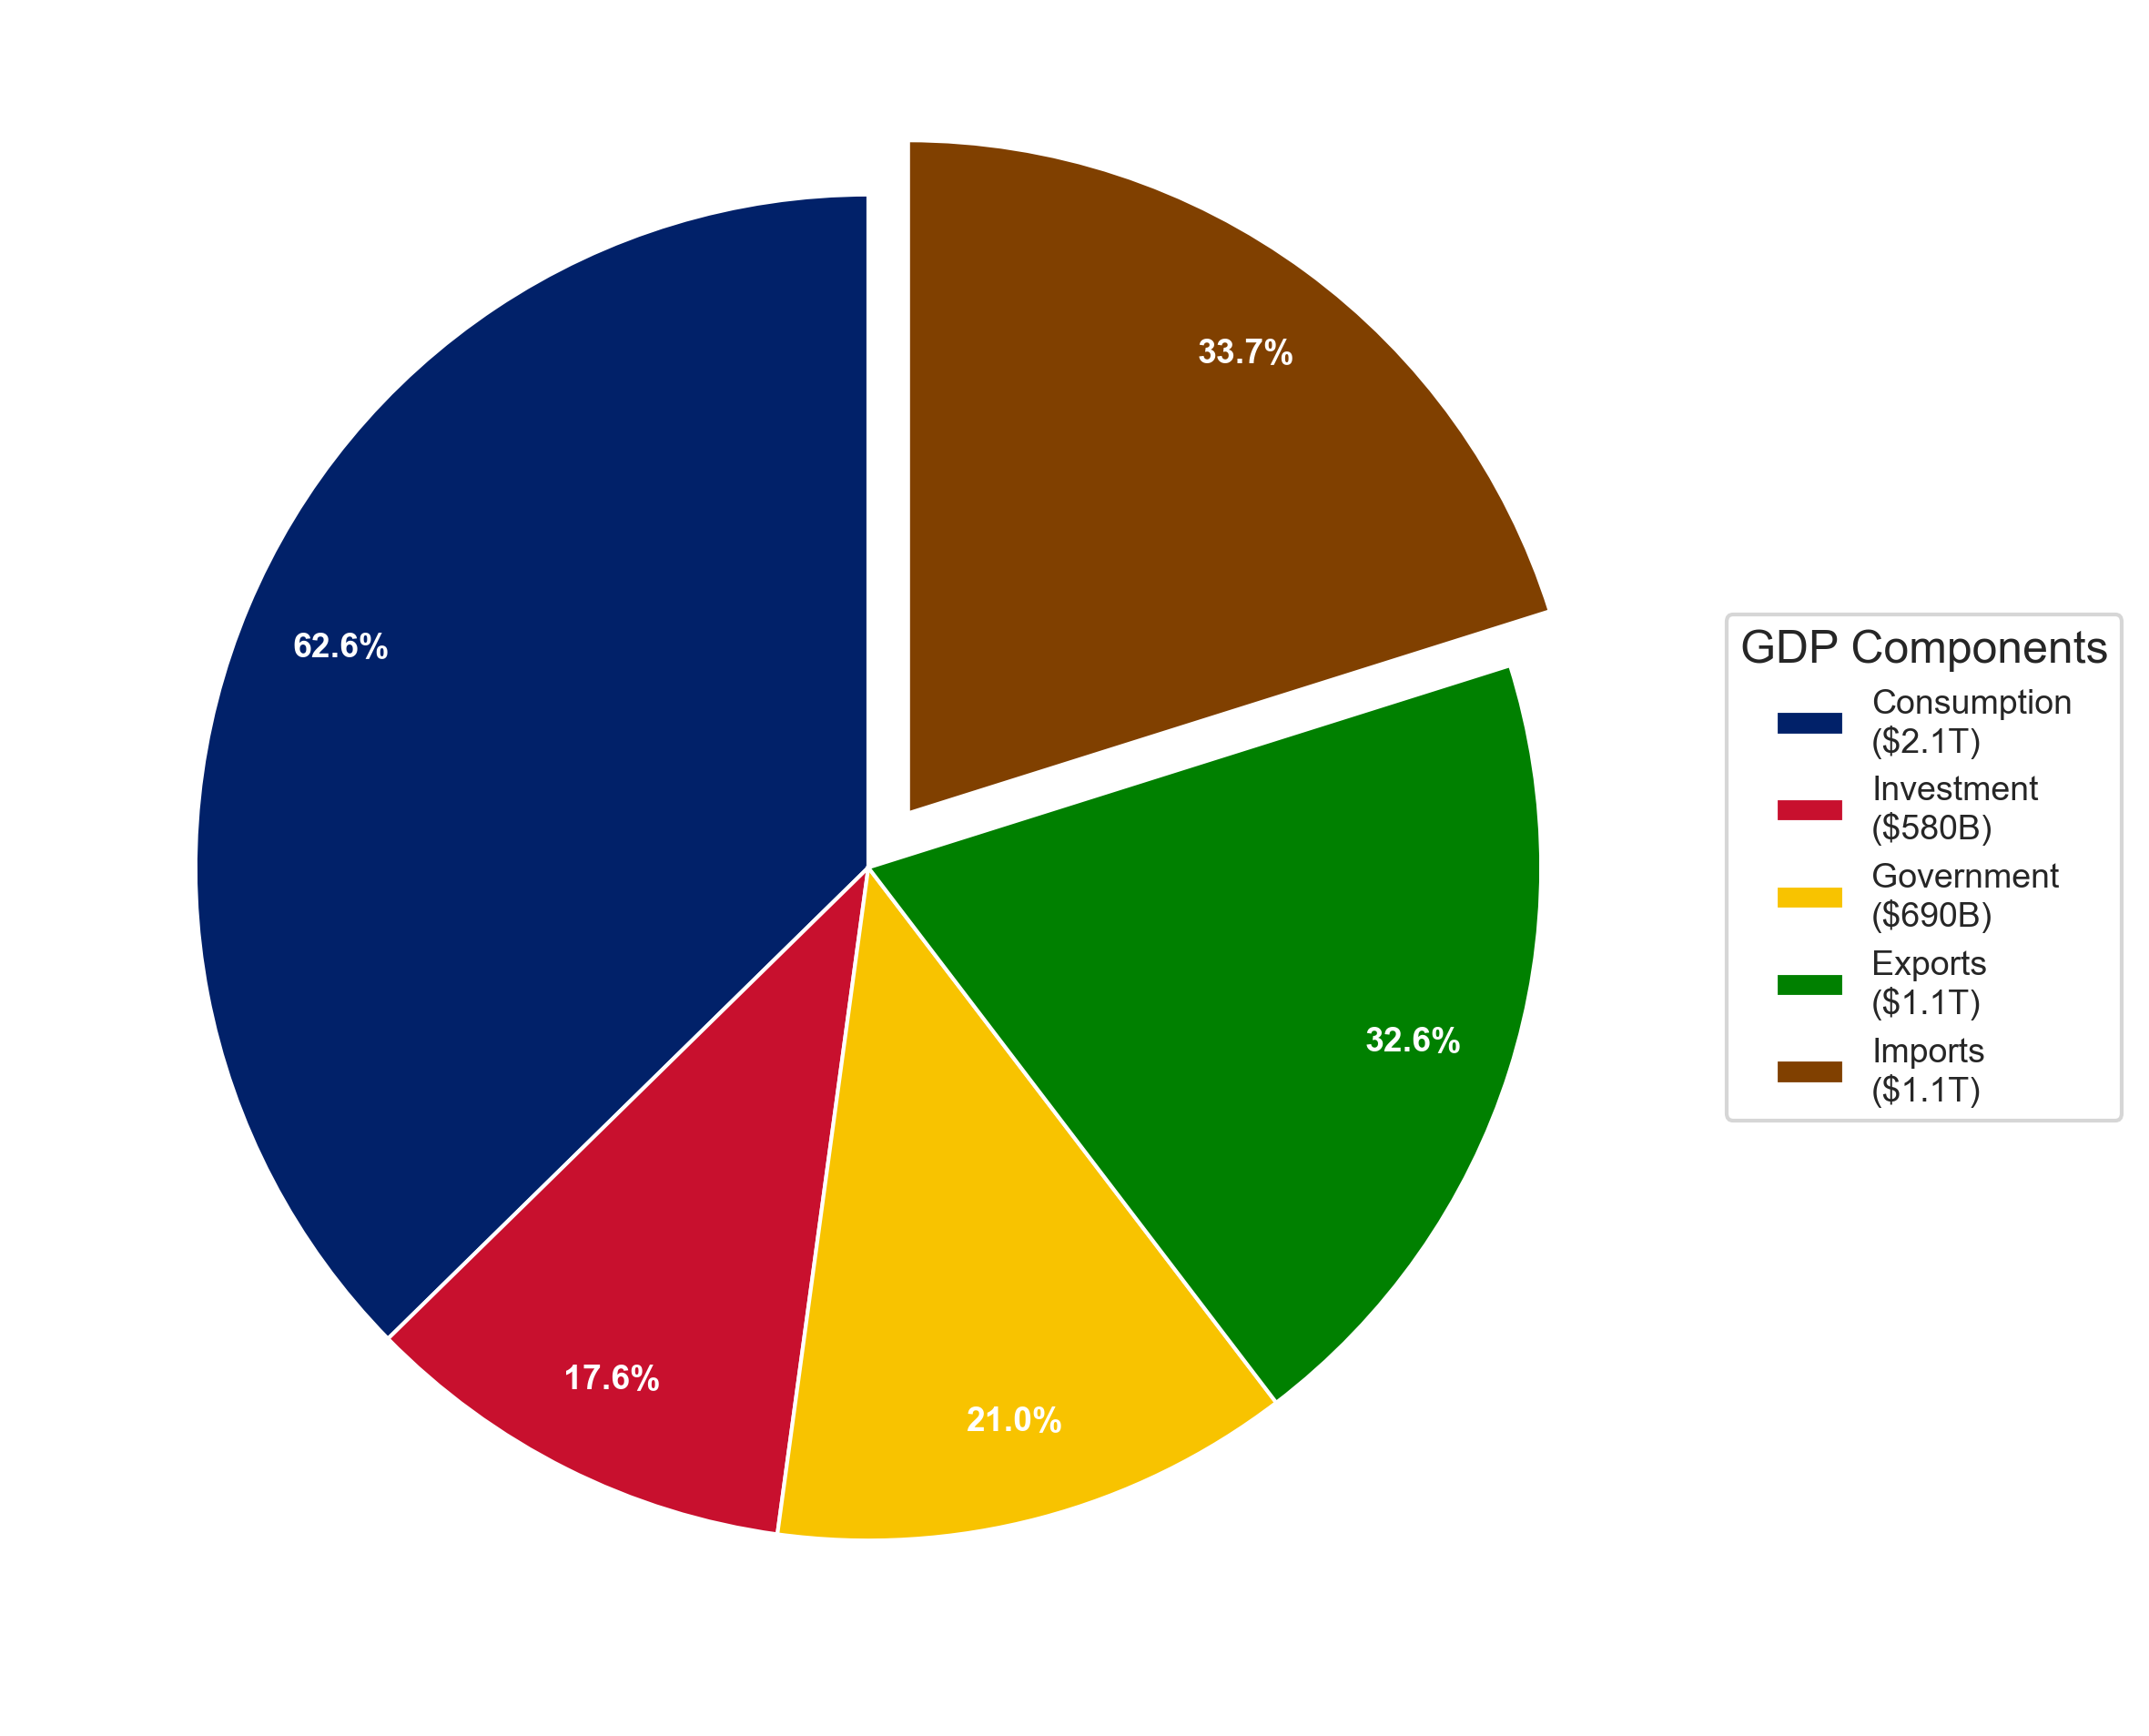
Figure 2: United Kingdom GDP Composition by Expenditure (C+I+G+NX), 2023
Detailed breakdown of United Kingdom’s Gross Domestic Product by expenditure components
| Component | Amount | Percentage | Pie Chart % |
|---|---|---|---|
| Consumption | $2.06T | 62.5% | 37.3% |
| Investment | $580B | 17.6% | 10.5% |
| Government | $690B | 21.0% | 12.5% |
| Exports | $1.08T | 32.6% | 19.5% |
| Imports | $1.11T | -33.7% | 20.1% |
| Total GDP | $3.30T | 100.0% | 100.0% |
Source: World Bank WDI (NE.* series), 2023. Nominal, current USD.
Sources & notes
- Sector data (2024): World Bank, World Development Indicators — NV.AGR.TOTL.ZS, NV.IND.TOTL.ZS, NV.SRV.TOTL.ZS. Value-added as % of GDP, current prices. Accessed 2026-06-21.
- Expenditure data (2023): World Bank WDI (NE.* series). Nominal, current USD. Accessed 2026-06-21.
- Residual: Taxes less subsidies on products + FISIM (Financial Intermediation Services Indirectly Measured). Structural national accounts item under the UN System of National Accounts; not allocated to any individual sector.
- Sector shares use the most recently published World Bank figures (2024 for NV.* series; 2023 for expenditure). The two years differ because WB updates sector and expenditure series on slightly different schedules.