Singapore is one of the world’s most open economies, with GDP reaching SGD 766 billion in 2024. Services account for 73.0% of value-added, driven by finance, trade-related services, and logistics. Industry contributes 21.4% — deliberately high for a financial centre, anchored by precision manufacturing in semiconductors, pharmaceuticals, and petrochemicals on Jurong Island.
GDP by sector — which industries produce the value

Source: World Bank WDI (NV.AGR/IND/SRV.TOTL.ZS), 2024. Value-added as % of GDP, current prices.
| Sector | Share of GDP | What it includes |
|---|---|---|
| Services | 73.0% | Finance, wholesale/retail trade, transport & logistics, information & communications, professional services |
| Industry | 21.4% | Manufacturing (semiconductors, pharmaceuticals, petrochemicals), construction, utilities |
| Agriculture | 0.0% | Agriculture, fishing, quarrying — negligible in a 720 km² city-state |
| Residual | 5.6% | Taxes less subsidies on products (GST) + FISIM |
| Total | 100% |
What the numbers say
Singapore’s services share (73.0%) is comparable to Japan’s (69.8%) and the UK’s (71.3%), but well below the US (82.8%). Unlike Hong Kong, where services exceed 90% of GDP, Singapore has deliberately retained manufacturing as a hedge against pure financialisation. The Jurong Island petrochemical and pharmaceutical cluster, GlobalFoundries wafer fabs, and plants for Sanofi, AbbVie, and Pfizer keep industry at 21.4% — nearly double Hong Kong’s share.
Financial services are the dominant services sub-sector. Singapore’s position as regional headquarters for thousands of multinationals, combined with MAS-regulated asset management and a large FX and derivatives market, means finance alone contributes roughly 14% of GDP. Port and aviation services — the Port of Singapore is Asia’s second-largest container port, and Changi Airport handles 60 million passengers a year — add another sizable block.
Agriculture is essentially zero at 0.03%. Singapore imports over 90% of its food. Urban farming exists but is negligible in GDP terms.
The 5.6% residual is primarily Singapore’s GST (goods and services tax, raised to 9% in January 2024) plus FISIM. This residual explains the gap between WB figures and Wikipedia/CIA Factbook tables, which distribute product taxes proportionally across sectors and therefore show services at ~75% and industry at ~23%.
Data note: World Bank NV.* series, 2024. Residual 5.57% exceeds the 0.5pp threshold and is shown as a separate slice. Cross-check: SingStat Table M015651 (Department of Statistics Singapore, accessed 2026-06-23) gives manufacturing + construction + utilities = 21.45%, services industries + ownership of dwellings = 73.15%, other goods industries (agriculture/fishing/quarrying) = 0.03% — matching WB within 0.2pp. The remaining 0.2pp gap in the residual is FISIM, which SingStat absorbs into finance-sector GVA while WB reports it in the residual. Wikipedia/CIA Factbook figures differ by ~2pp because they distribute the product-tax residual proportionally rather than showing it separately. ✓
GDP by expenditure — who spends it
The sector chart above and the expenditure table below measure different things. Sector = which industries produce the value; expenditure = who spends it. Both are correct; they answer different questions.
Source: World Bank WDI, 2024. Shows how total spending is allocated, not which industries produce the output.
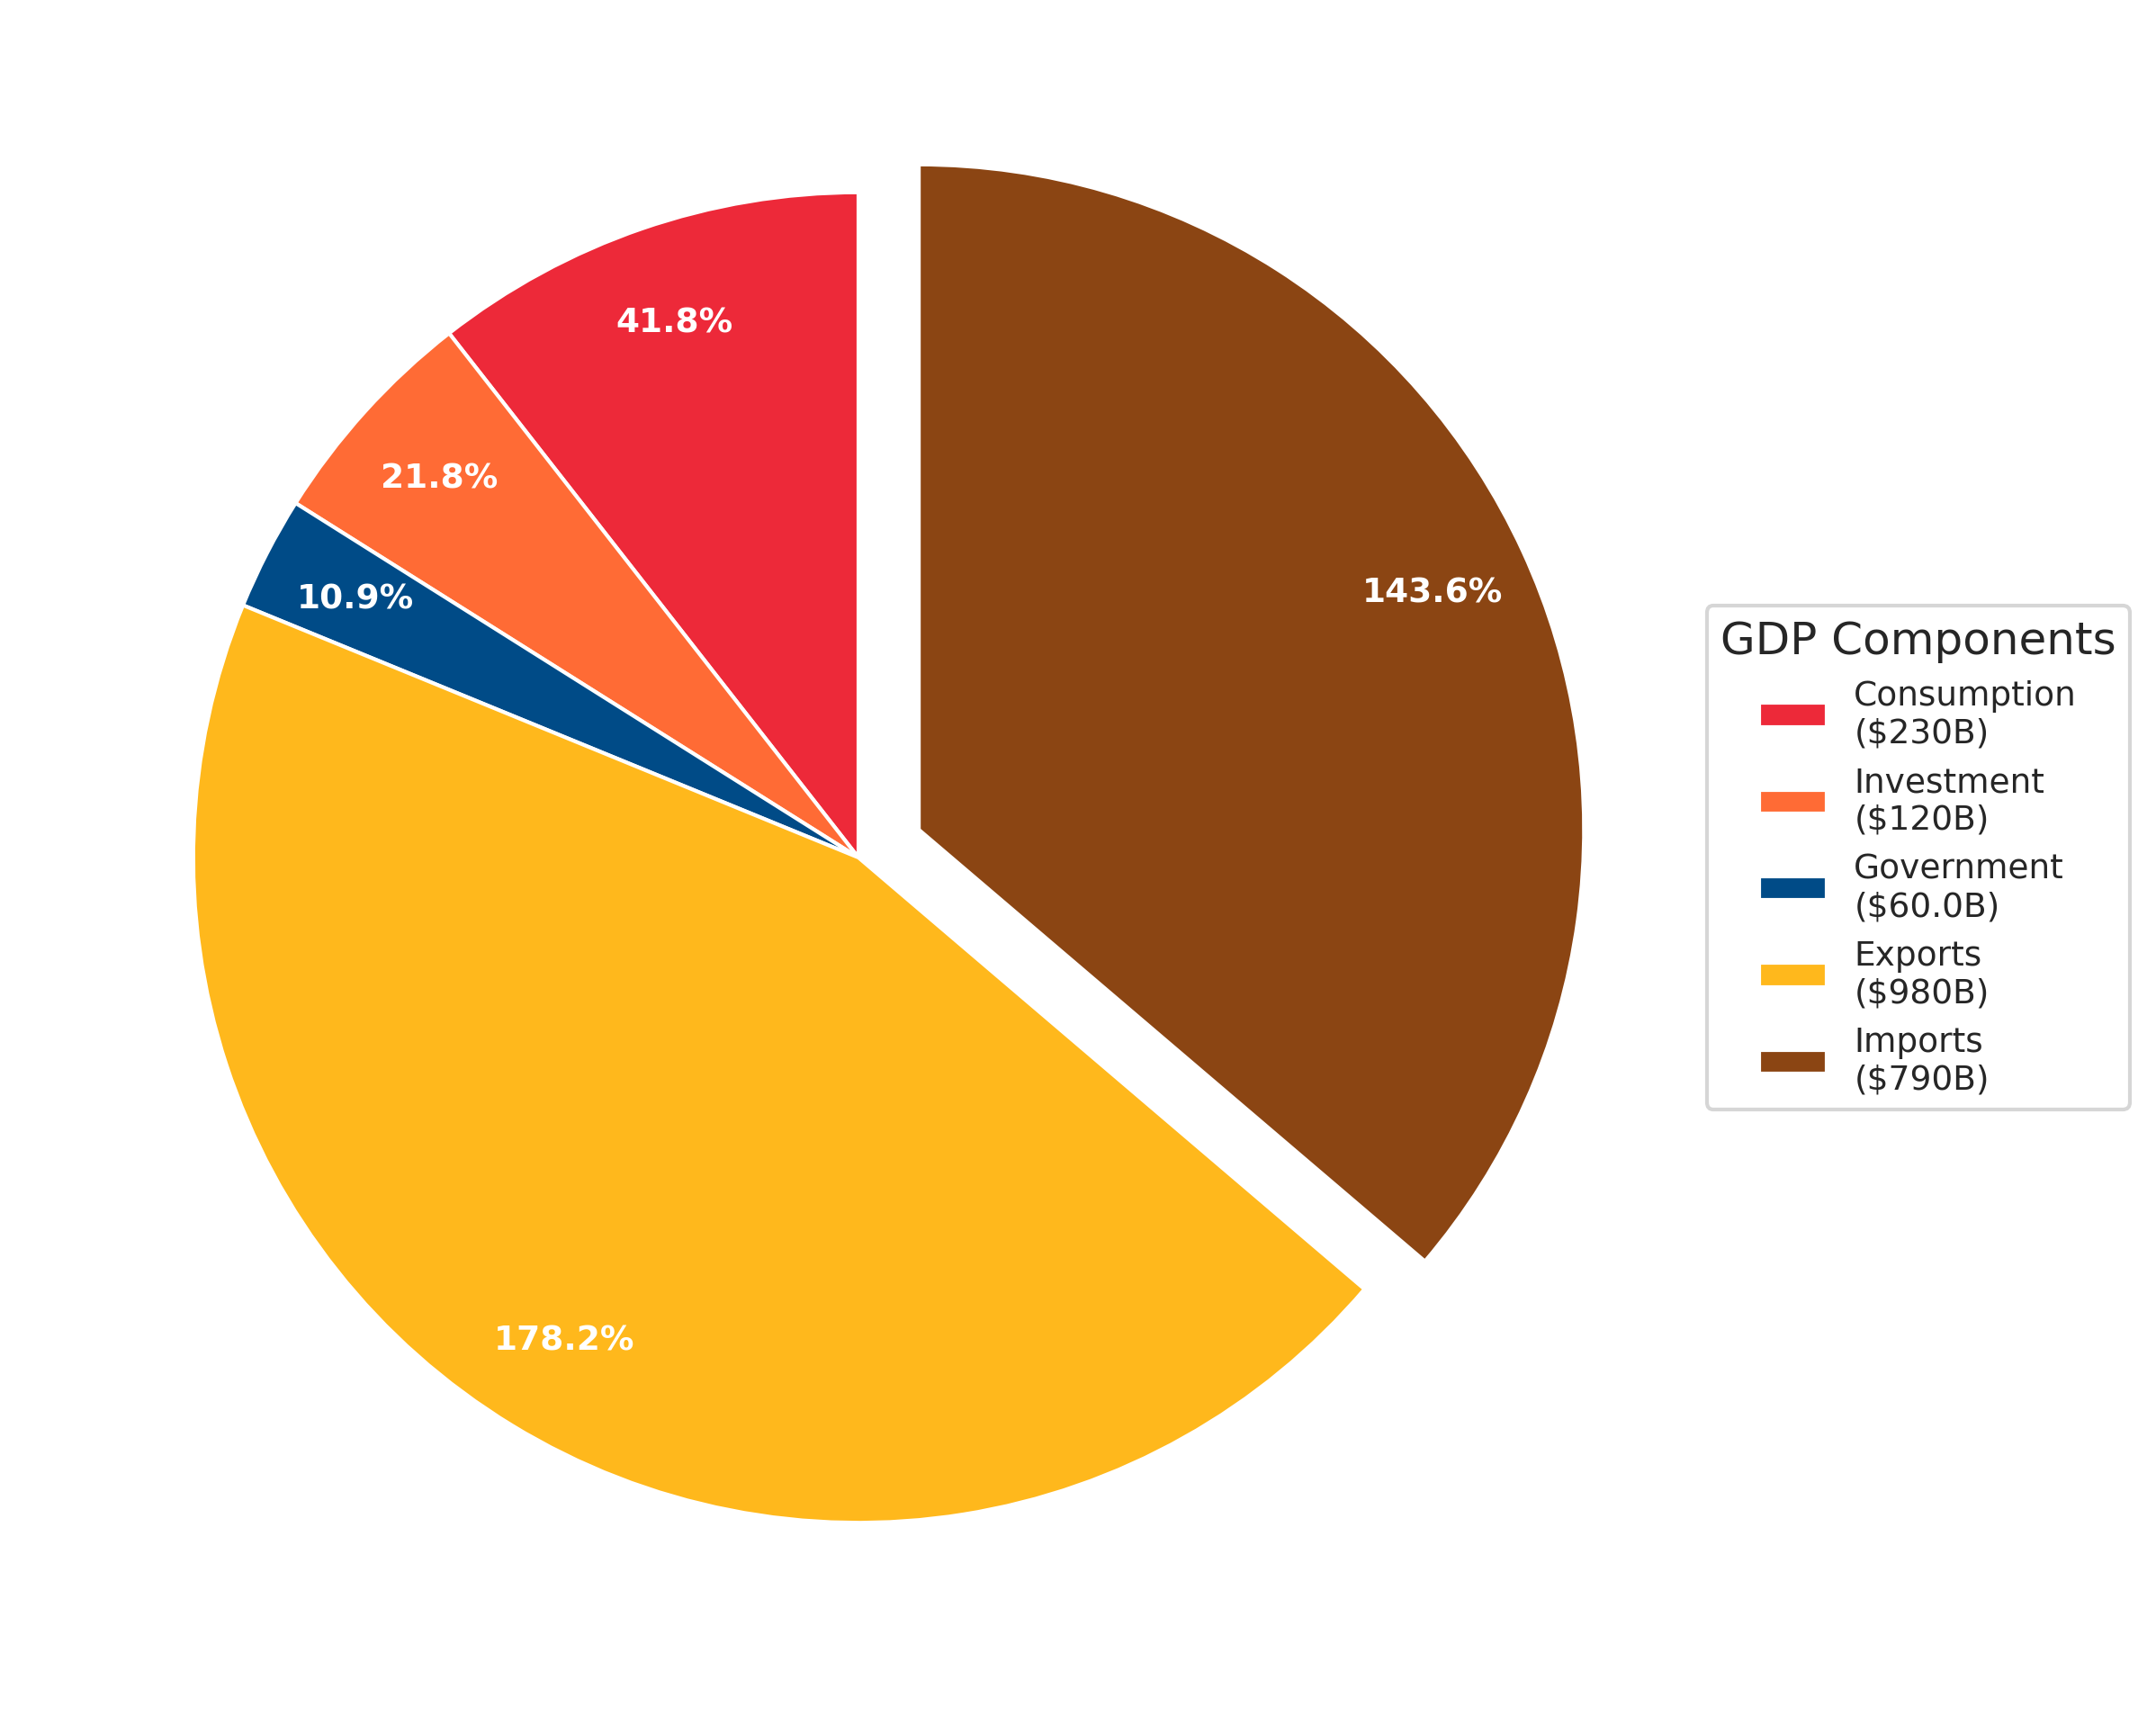
| Component | Amount | Percentage | Pie Chart % |
|---|---|---|---|
| Consumption | $170B | 31.7% | 8.1% |
| Investment | $120B | 22.3% | 5.7% |
| Government | $60.0B | 10.7% | 2.7% |
| Exports | $980B | 179.7% | 46.2% |
| Imports | $790B | -144.4% | 37.1% |
| Total GDP | $540B | 100.0% | 100.0% |
Singapore’s exports-to-GDP ratio of ~180% reflects its entrepôt role: goods are imported, processed or re-exported, and leave as higher-value products. This is structurally different from large economies like the US or China, where domestic demand dominates.
Source: World Bank, World Development Indicators, 2024. Nominal, current USD.
Sources & notes
- Sector data (2024): World Bank, World Development Indicators — NV.AGR.TOTL.ZS, NV.IND.TOTL.ZS, NV.SRV.TOTL.ZS. Value-added as % of GDP, current prices. Accessed 2026-06-21.
- SingStat cross-check: Department of Statistics Singapore, Table M015651, “GDP at Current Prices by Industry (SSIC 2020), Quarterly,” accessed 2026-06-23. Rolled-up 2024 annual: industry 21.45%, services 73.15%, agriculture 0.03% — within 0.2pp of WB. ✓
- Expenditure data (2024): World Bank, World Development Indicators. Nominal, current USD.
- Cross-check (normalized vs Wikipedia): Normalizing WB values (excluding residual) gives services 77.3%, industry 22.6%, agriculture 0.03%. Wikipedia/CIA Factbook shows services ~75%, industry ~23% — gap of ~2pp, consistent with residual redistribution. ✓