Japan’s economy reached $4.21 trillion in 2023, the fourth-largest in the world. Services account for 69.8% of value-added, driven by wholesale and retail trade, finance, real estate, and a large healthcare sector serving one of the world’s oldest populations. Industry contributes 28.6% — significantly higher than the US or UK, reflecting Japan’s deep manufacturing base in automotive, electronics, and industrial machinery.
GDP by sector — which industries produce the value

Source: World Bank WDI (NV.AGR/IND/SRV.TOTL.ZS), 2023. Value-added as % of GDP, current prices.
| Sector | Share of GDP | What it includes |
|---|---|---|
| Services | 69.8% | Wholesale/retail, finance, real estate, healthcare, education, information services |
| Industry | 28.6% | Manufacturing, construction, mining, utilities |
| Agriculture | 0.9% | Farming, livestock, fishing, forestry |
| Residual | 0.7% | Taxes less subsidies on products + FISIM |
| Total | 100% |
What the numbers say
Japan’s industry share (28.6%) sits well above the US (16.4%) and UK (17.1%), but below South Korea (33.9%) and well below China (36.5%) — reflecting the partial hollowing-out (kudōka) of Japanese manufacturing since the 1990s as production shifted to lower-cost Asian neighbours. Japanese industry has retained its highest-value segments: automotive (Toyota, Honda), precision electronics, and industrial equipment remain globally dominant.
Services at 69.8% are shaped by Japan’s demographics. An ageing population — over 28% aged 65 or older — drives disproportionate demand for healthcare and social care, sectors that count as services. Finance and real estate in Tokyo, and a large domestic retail and distribution network, make up most of the remainder.
Agriculture at 0.9% is small by share but strategically important; Japan has long sought food self-sufficiency due to island geography, and maintains high tariff protection on rice. The sector produces high-value output — Japan is a leading exporter of wagyu beef and premium seafood — with a tiny but ageing farm workforce.
Data note: World Bank NV.* series, 2023. Residual of 0.7% is just above the 0.5pp threshold and is shown as a separate slice. Cross-check: normalized values (services 70.3%, industry 28.8%) match Wikipedia/CIA Factbook (services 71.4%, industry 27.5%) within 1.3pp. ✓
GDP by expenditure — who spends it
The sector chart above and the expenditure table below measure different things. Sector = which industries produce the value; expenditure = who spends it. Both are correct; they answer different questions.
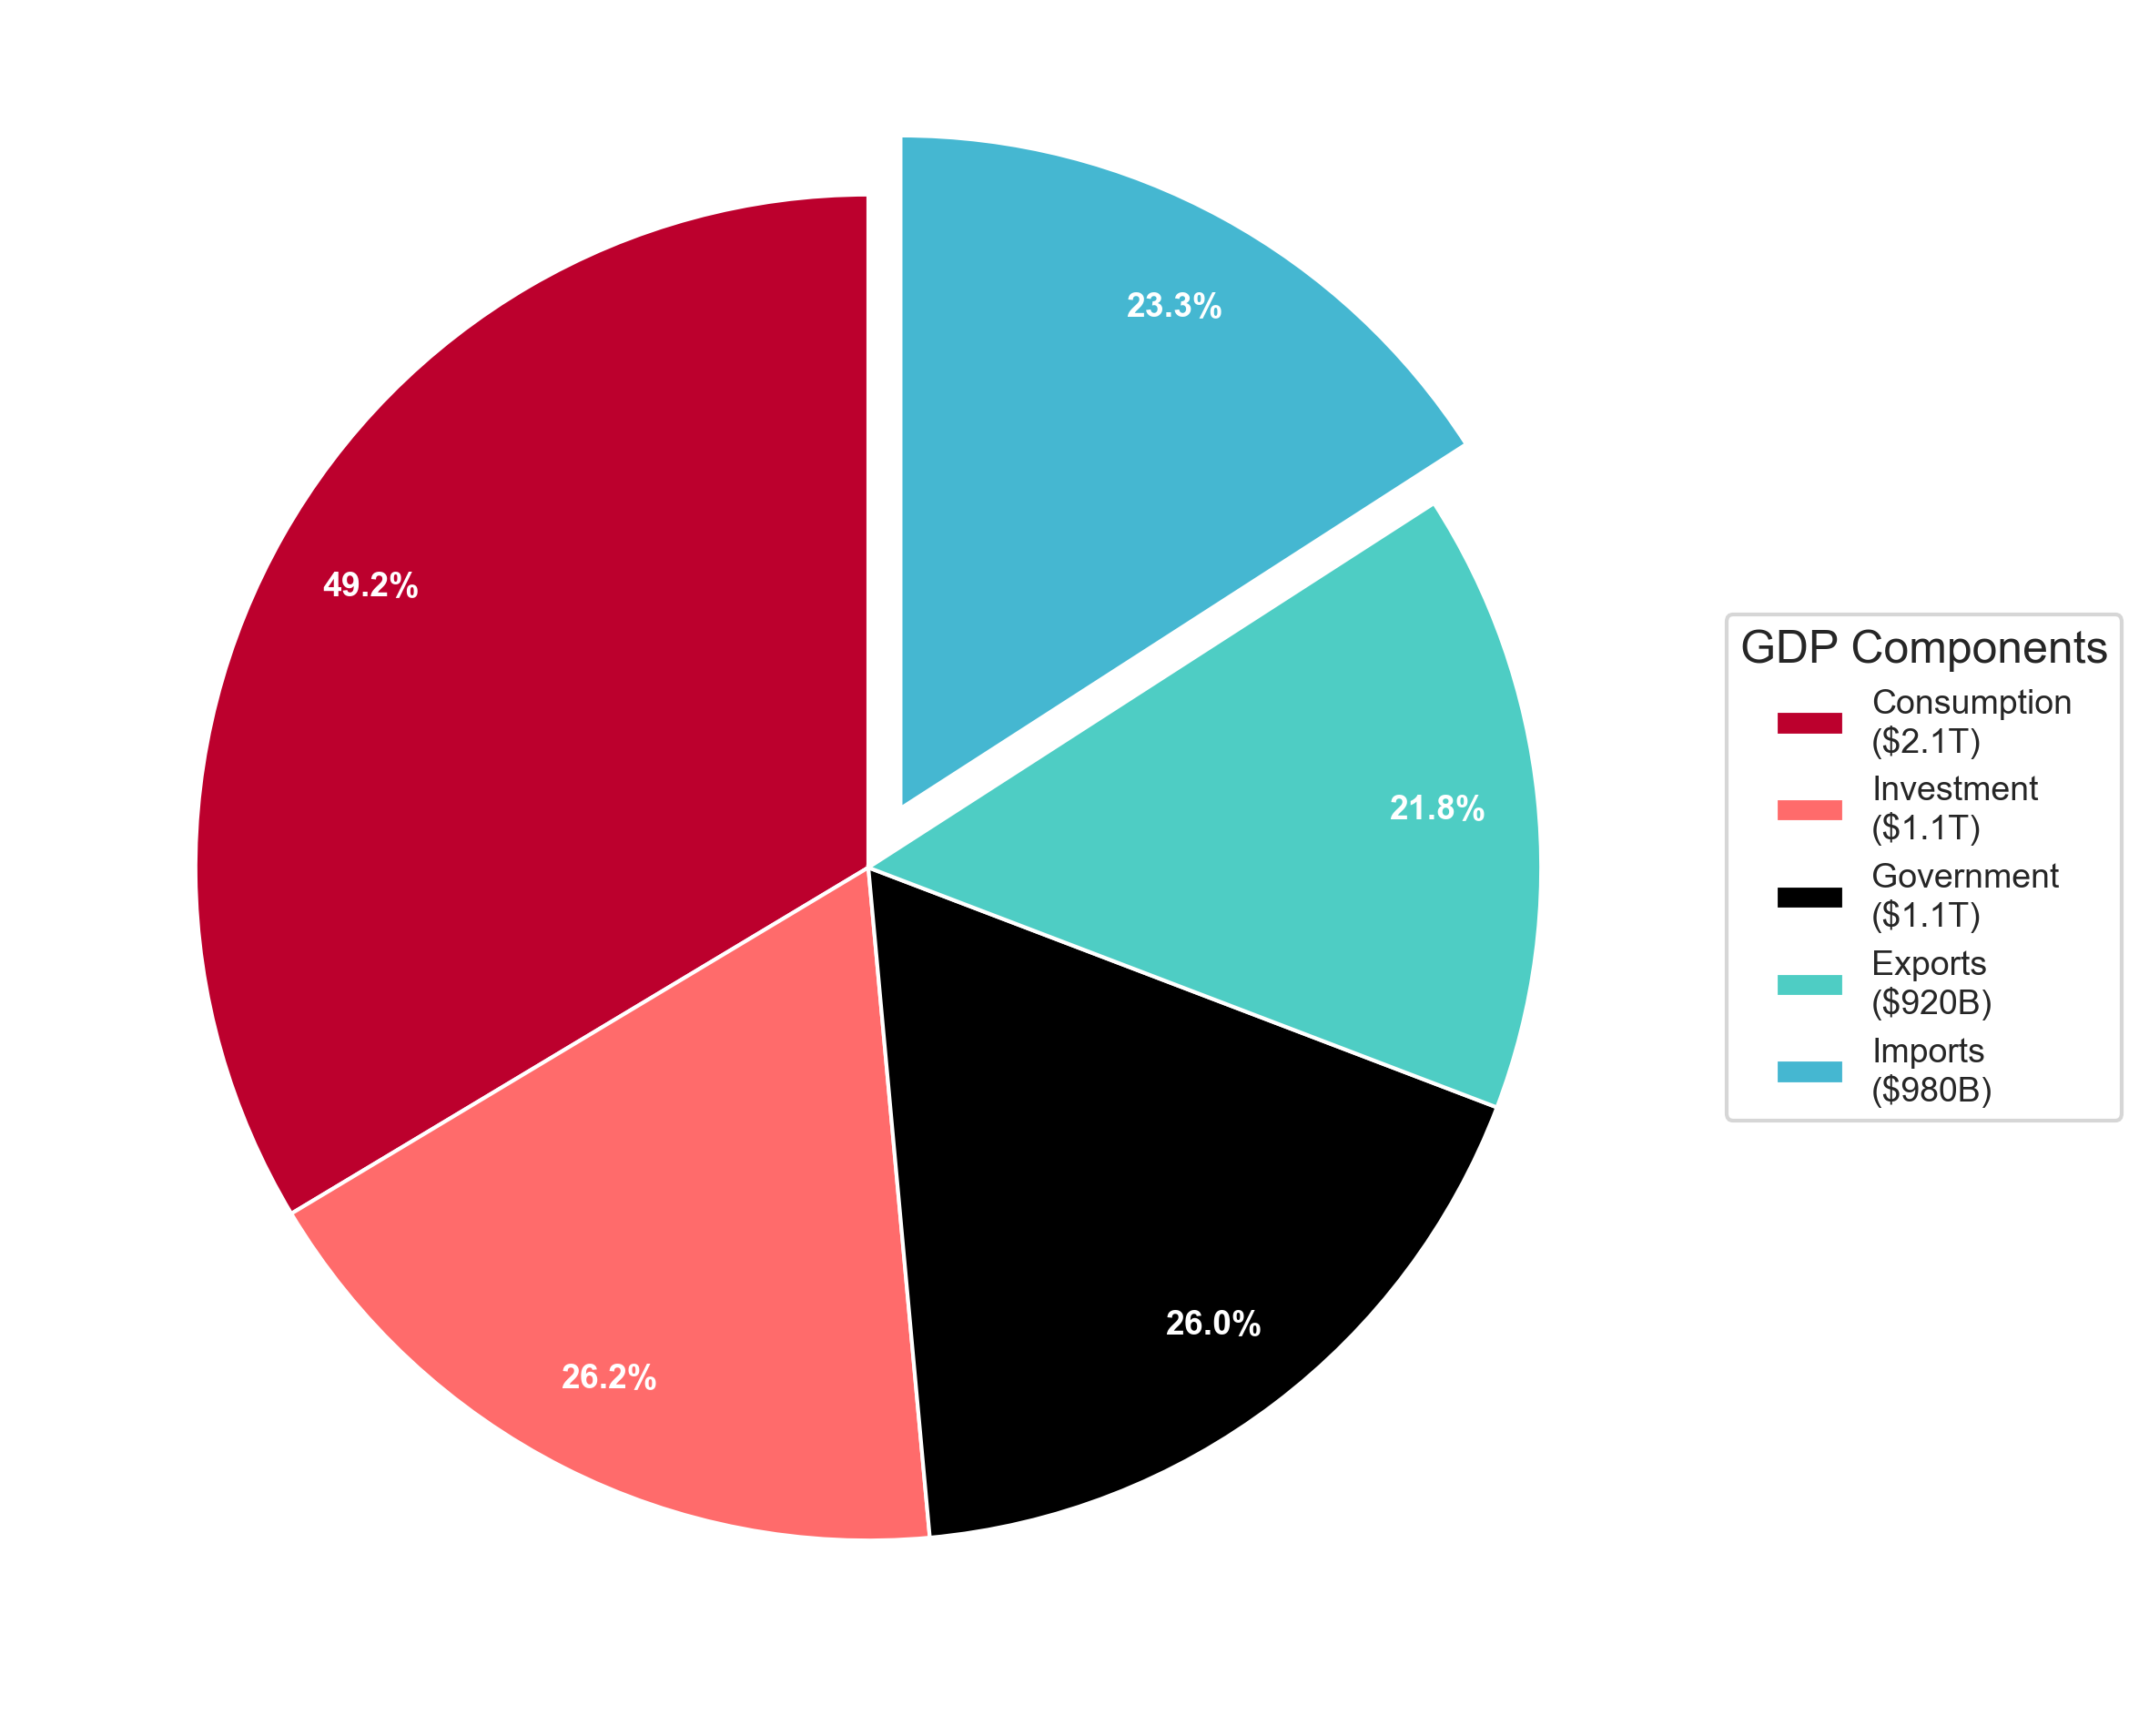
Source: World Bank WDI, 2023. Shows how total spending is allocated, not which industries produce the output.
| Component | Amount | Percentage | Pie Chart % |
|---|---|---|---|
| Consumption | $2.08T | 49.2% | 33.6% |
| Investment | $1.10T | 26.2% | 17.9% |
| Government | $1.10T | 26.0% | 17.7% |
| Exports | $920B | 21.9% | 14.9% |
| Imports | $980B | -23.3% | 15.9% |
| Total GDP | $4.21T | 100.0% | 100.0% |
Source: World Bank, World Development Indicators, 2023. Current USD.
Sources & notes
- Sector data (2023): World Bank, World Development Indicators — NV.AGR.TOTL.ZS, NV.IND.TOTL.ZS, NV.SRV.TOTL.ZS. Value-added as % of GDP, current prices. Accessed 2026-06-21.
- Expenditure data (2023): World Bank, World Development Indicators. Nominal, current USD.
- Cross-check (normalized vs Wikipedia): Services 70.3% vs 71.4% (1.1pp), industry 28.8% vs 27.5% (1.3pp), agriculture 0.9% vs 1.2% (0.3pp). All within ±2pp. ✓