India’s GDP is roughly split between services (49.9%) and the rest, but its standout feature is agriculture: at 16.3% of value-added it is far larger than in any other major economy. That single number captures India’s stage of development — a fast-growing services and industrial economy that still has a very large farm sector. Figures are World Bank value-added shares for 2024; headline nominal GDP was $3.91 trillion.
GDP by sector — which industries produce the value

Source: World Bank WDI (NV.AGR/IND/SRV.TOTL.ZS), 2024. Value-added as % of GDP, current prices.
| Sector | Share of GDP | What it includes |
|---|---|---|
| Services | 49.9% | IT and business services, finance, trade, transport, real estate |
| Industry | 24.6% | Manufacturing, construction, mining, utilities |
| Agriculture | 16.3% | Farming, livestock, fishing, forestry |
| Taxes, subsidies & FISIM | 9.2% | National accounts residual — not a sector |
| Total | 100% |
What the numbers say
India’s 16.3% agriculture share is the highest among the world’s large economies — for comparison the figure is under 1% in the UK and around 2% in Australia and Canada. But the deeper story is the mismatch between output and jobs: agriculture produces about a sixth of India’s GDP while still employing roughly 40% of its workforce, a productivity gap that sits at the centre of the country’s development challenge.
Services at 49.9% are the engine of modern India — the IT and business-process industries around Bengaluru, Hyderabad, and Pune, plus finance and a vast domestic trade and transport sector. Industry at 24.6% is smaller than China’s 36.5%, and closing that manufacturing gap is the explicit aim of India’s “Make in India” policy.
The long arc is dramatic. In 1960 agriculture was 41.7% of India’s GDP and services 38.8%; by 2024 agriculture had fallen to 16.3% while services climbed to 49.9%. India has, in other words, moved from a farm economy toward a services economy in two generations — but with a larger agricultural tail than the East Asian economies that industrialised before it.
The 9.2% residual — taxes less subsidies on products plus FISIM — is high by international standards, reflecting India’s product-tax structure (GST) and a large financial sector.
Data note: World Bank NV.* series, 2024, written as published (DATA-POLICY §9.1). An independent World Bank–sourced search confirms India’s agriculture value-added at 16.29% for 2024, matching the figure shown. World Bank WDI is authoritative; values are raw, not normalized.
The section below is the original GDP-by-expenditure breakdown — who spends (consumption, investment, government, net trade). It measures something different from the sector chart above: sector = which industries produce the value; expenditure = who spends it. Both are correct; they answer different questions.
India GDP Pie Chart 2024
India’s GDP composition 2024 pie chart showing components breakdown. India’s rapidly expanding economy showed strong domestic consumption and increasing investment activity as the fastest-growing major economy.
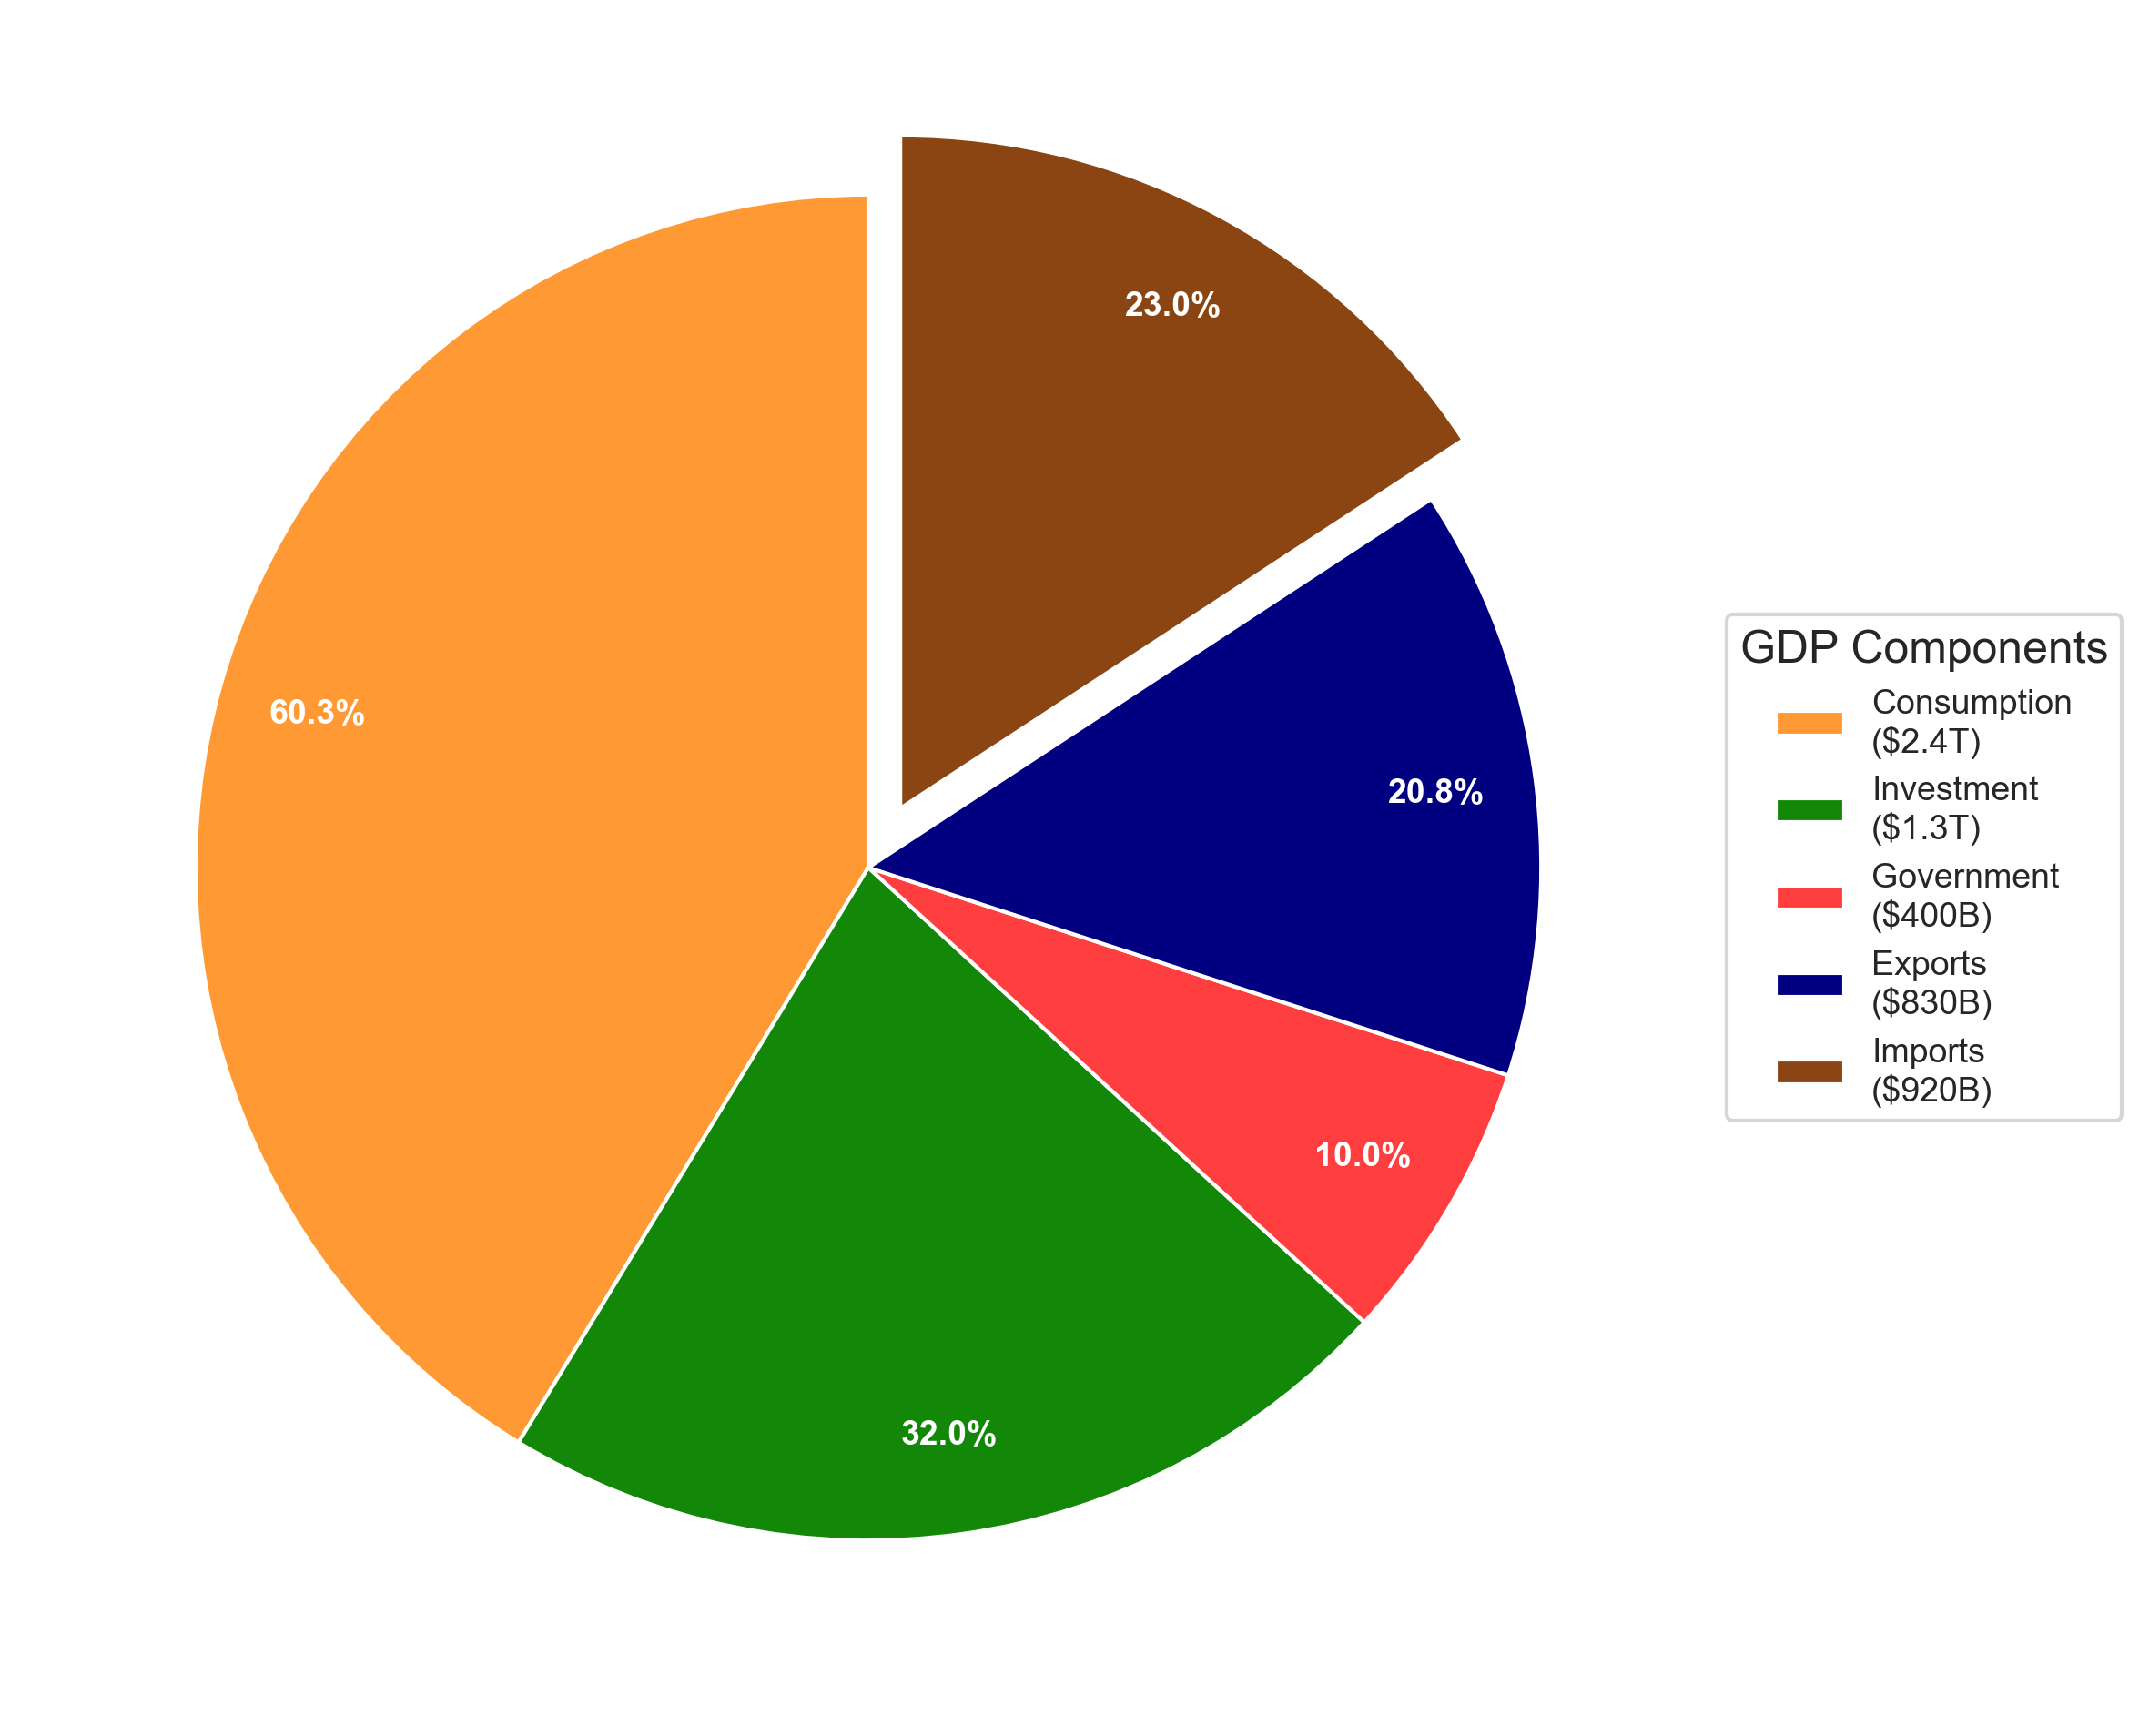
Figure 1: India GDP Composition Breakdown 2024 - Pie Chart Visualization
India GDP Components Table 2024
Detailed breakdown of India’s Gross Domestic Product by expenditure components:
| Component | Amount | Percentage | Pie Chart % |
|---|---|---|---|
| Consumption | $2.41T | 60.3% | 41.3% |
| Investment | $1.28T | 32.0% | 21.9% |
| Government | $400B | 9.9% | 6.8% |
| Exports | $830B | 20.8% | 14.2% |
| Imports | $920B | -23.1% | 15.8% |
| Total GDP | $3.91T | 100.0% | 100.0% |
Source: World Bank, World Development Indicators (2024). $3.91T is the World Bank’s headline nominal GDP for India in 2024. Summing the expenditure-side components above yields approximately $3.99T; the ~$80B gap reflects statistical adjustments and rounding in the source data. Where figures conflict, the $3.91T headline is the primary reference.
Key Economic Insights: India 2024
- Primary Economic Driver: Consumption is the largest component of GDP at 60.3%
- International Trade: Trade deficit with exports at $830B and imports at $920B
- Investment Level: 32.0% of GDP allocated to capital investment
- Economic Scale: Total GDP of $3.91T in 2024
Methodology and Data Sources
The GDP composition data follows the expenditure approach calculation method and is sourced from World Development Indicators (World Bank). Pie chart percentages are normalized to sum to 100% for clear visual representation.
Note: Due to statistical discrepancies in data collection and rounding, the sum of individual components may not exactly equal the total GDP. Data represents the most recent available figures for 2024.