Canada’s economy reached $2.16 trillion in 2023, the ninth-largest in the world. Services account for 66.4% of value-added — a share comparable to Australia and Germany, driven by finance, real estate, retail, and professional services. Industry contributes 25.3%, notably higher than the US or UK, reflecting Canada’s substantial energy and natural resources sector.
GDP by sector — which industries produce the value

Source: World Bank WDI (NV.AGR/IND/SRV.TOTL.ZS), 2021. Value-added as % of GDP, current prices.
| Sector | Share of GDP | What it includes |
|---|---|---|
| Services | 66.4% | Finance, real estate, retail, professional services, healthcare, education |
| Industry | 25.3% | Manufacturing, construction, mining, oil and gas, utilities |
| Agriculture | 1.6% | Farming, livestock, fishing, forestry |
| Residual | 6.7% | Taxes less subsidies on products + FISIM |
| Total | 100% |
What the numbers say
Canada’s industry share (25.3%) is considerably higher than the US (16.4%) or UK (17.1%), driven by the oil sands in Alberta and a broad mining and energy complex that accounts for a large share of export revenue. Yet over two-thirds of GDP still comes from services — finance in Toronto, tech in Vancouver and Waterloo, and a sprawling public-sector services base that reflects Canada’s universal healthcare and social programmes.
Agriculture at 1.6% understates Canada’s role in global food supply. Canada is among the world’s largest exporters of wheat, canola, and pulses; the sector’s small GDP share reflects high productivity with a very small workforce rather than small output.
The 6.7% residual — taxes less subsidies on products plus FISIM — is similar to Australia and Singapore. Canada’s financial sector, dominated by the “Big Six” banks, generates significant FISIM that elevates this adjustment.
Data note: World Bank NV.* series, 2021. 2021 is the latest year for which World Bank publishes complete three-sector data for Canada; WB coverage for Canada lags most other G7 countries by 2–3 years. Cross-check: normalized WB values (services 71.1%, industry 27.1%) are within 1.5pp of Wikipedia/CIA Factbook figures (services 69.6%, industry 28.6%). ✓
GDP by expenditure — who spends it
The sector chart above and the expenditure table below measure different things. Sector = which industries produce the value; expenditure = who spends it. Both are correct; they answer different questions.
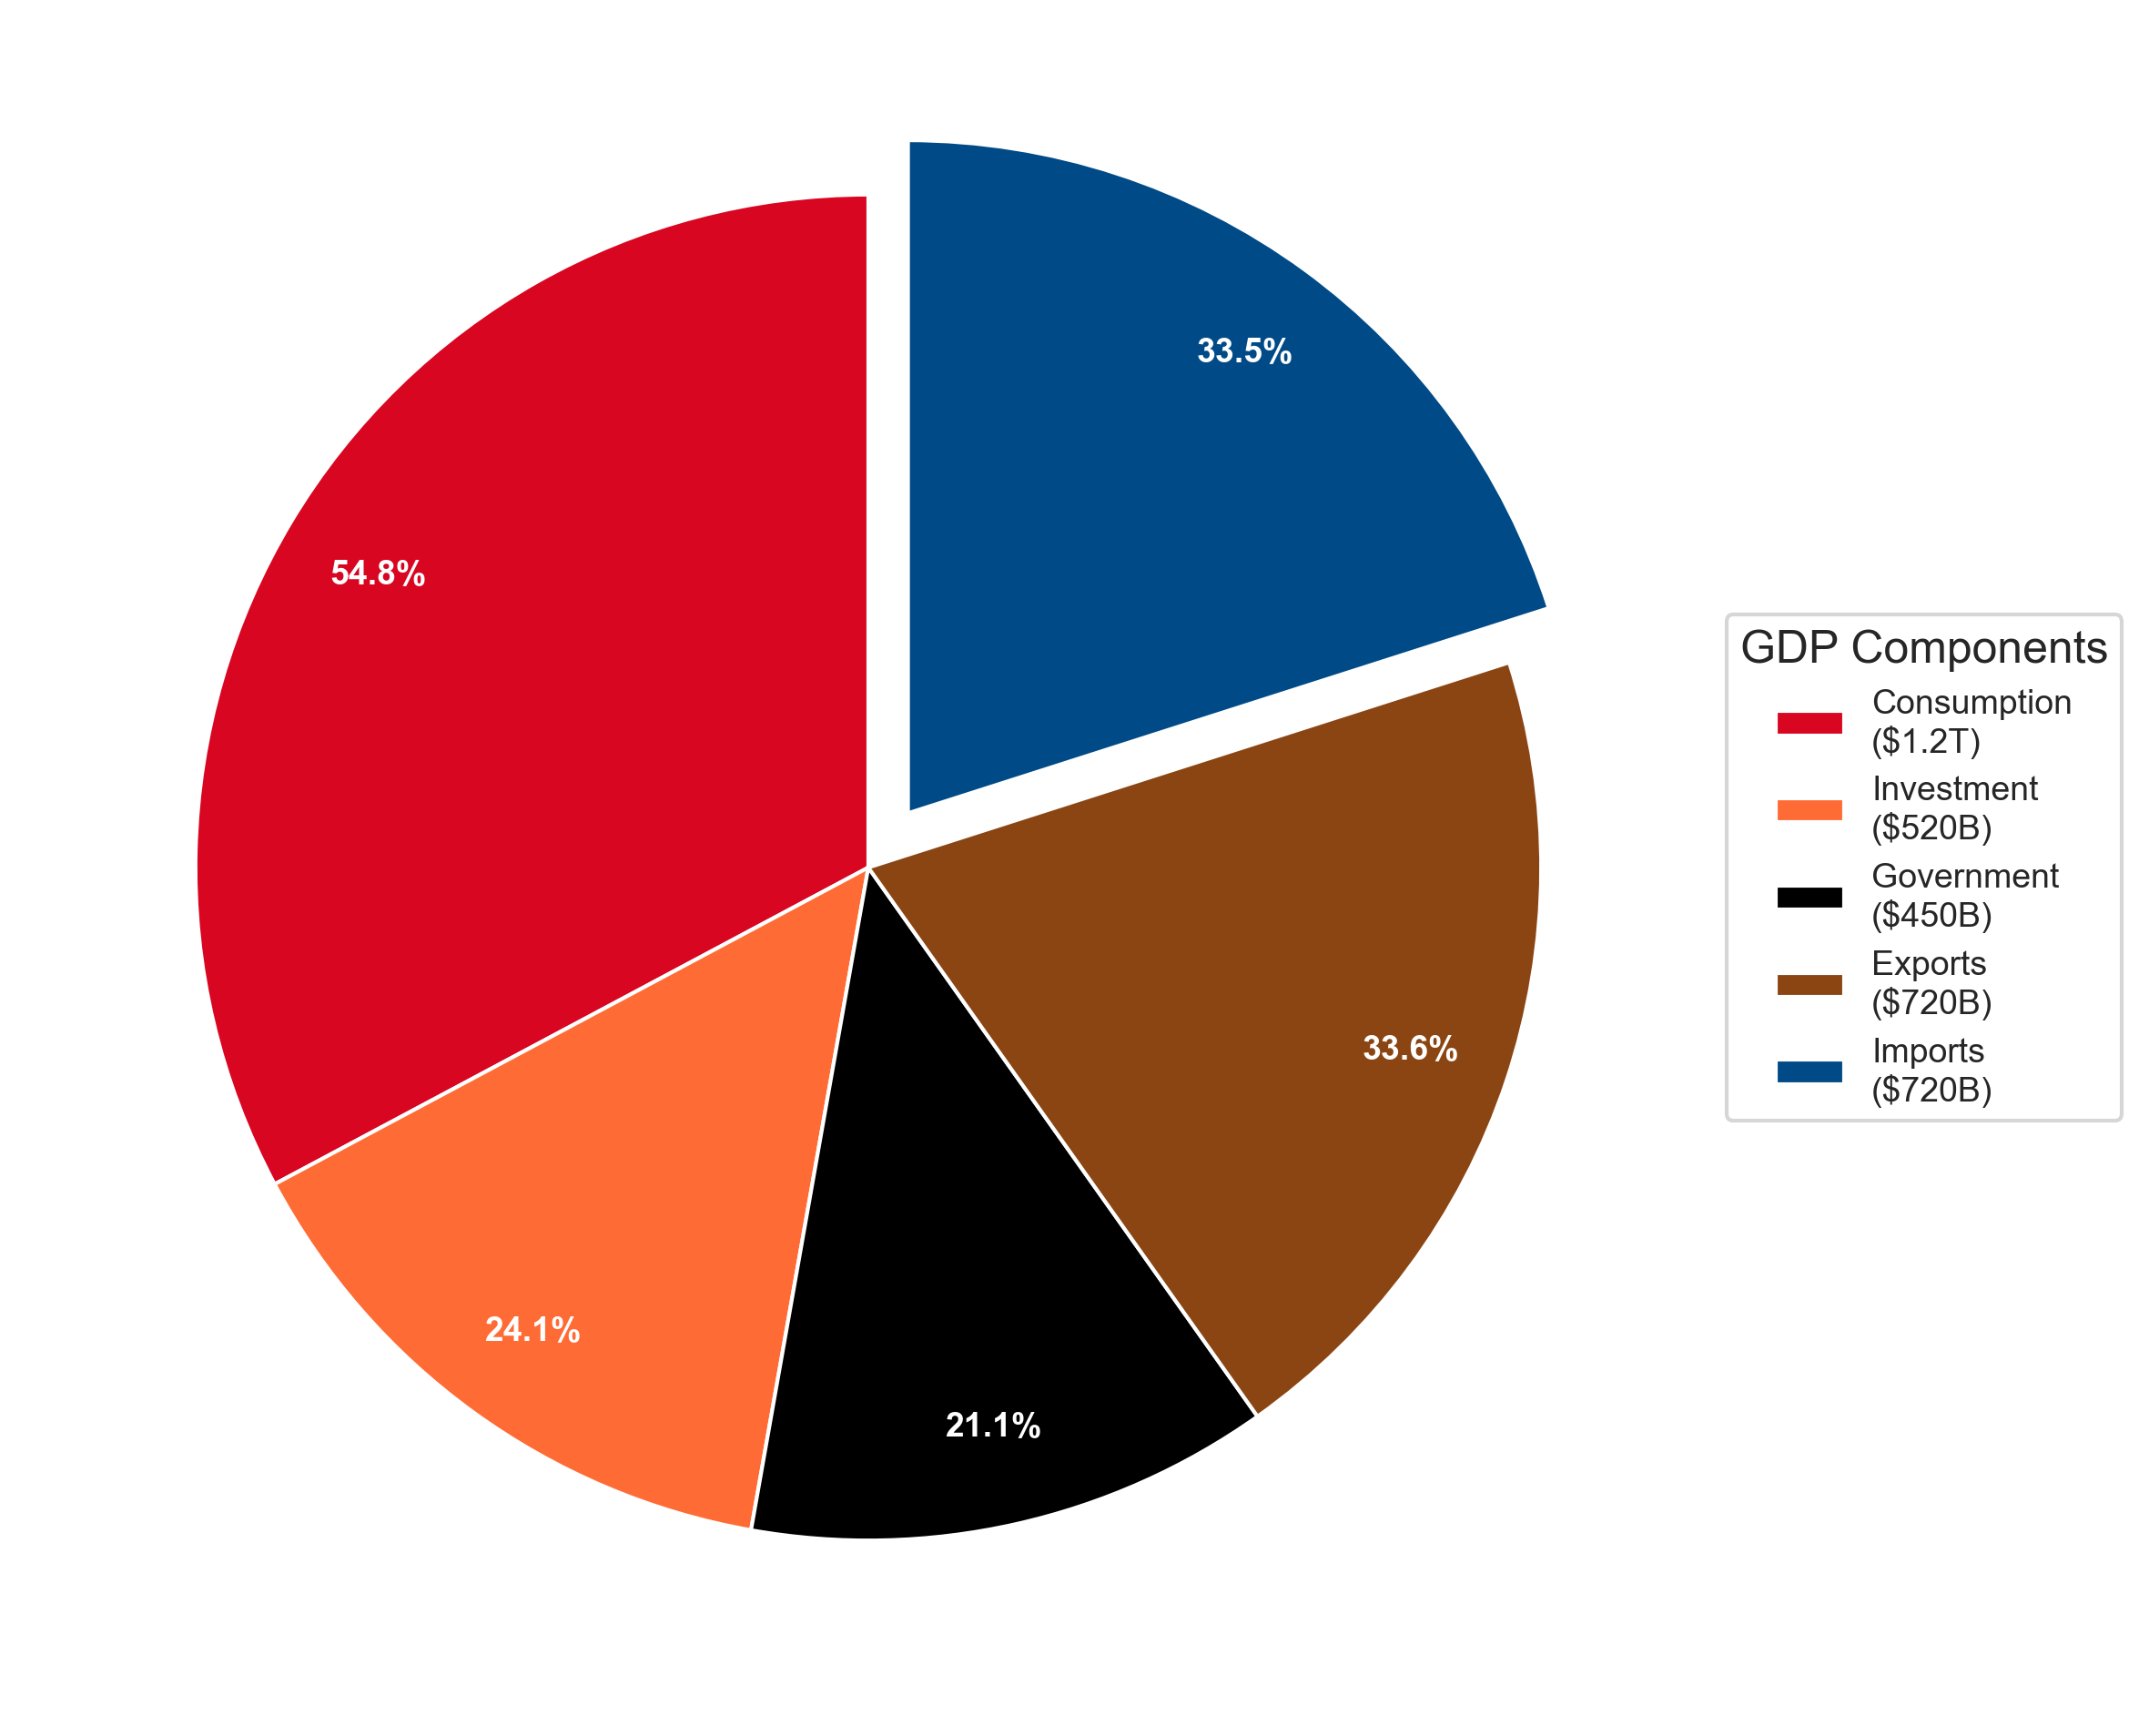
Source: World Bank WDI, 2023. Shows how total spending is allocated, not which industries produce the output.
| Component | Amount | Percentage | Pie Chart % |
|---|---|---|---|
| Consumption | $1.18T | 54.8% | 32.8% |
| Investment | $520B | 24.1% | 14.4% |
| Government | $450B | 21.1% | 12.6% |
| Exports | $720B | 33.6% | 20.1% |
| Imports | $720B | -33.5% | 20.1% |
| Total GDP | $2.16T | 100.0% | 100.0% |
Source: World Bank, World Development Indicators, 2023. Current USD.
Sources & notes
- Sector data (2021): World Bank, World Development Indicators — NV.AGR.TOTL.ZS, NV.IND.TOTL.ZS, NV.SRV.TOTL.ZS. Value-added as % of GDP, current prices. Accessed 2026-06-21. Note: WB does not yet publish 2022–2024 complete sector data for Canada.
- Expenditure data (2023): World Bank, World Development Indicators. Nominal, current USD.
- Cross-check (normalized vs Wikipedia): Services 71.1% vs 69.6% (1.5pp), industry 27.1% vs 28.6% (1.5pp), agriculture 1.7% vs 1.8% (0.1pp). All within ±2pp. ✓