Brazil GDP Composition 2024 - Pie Chart & Components Breakdown
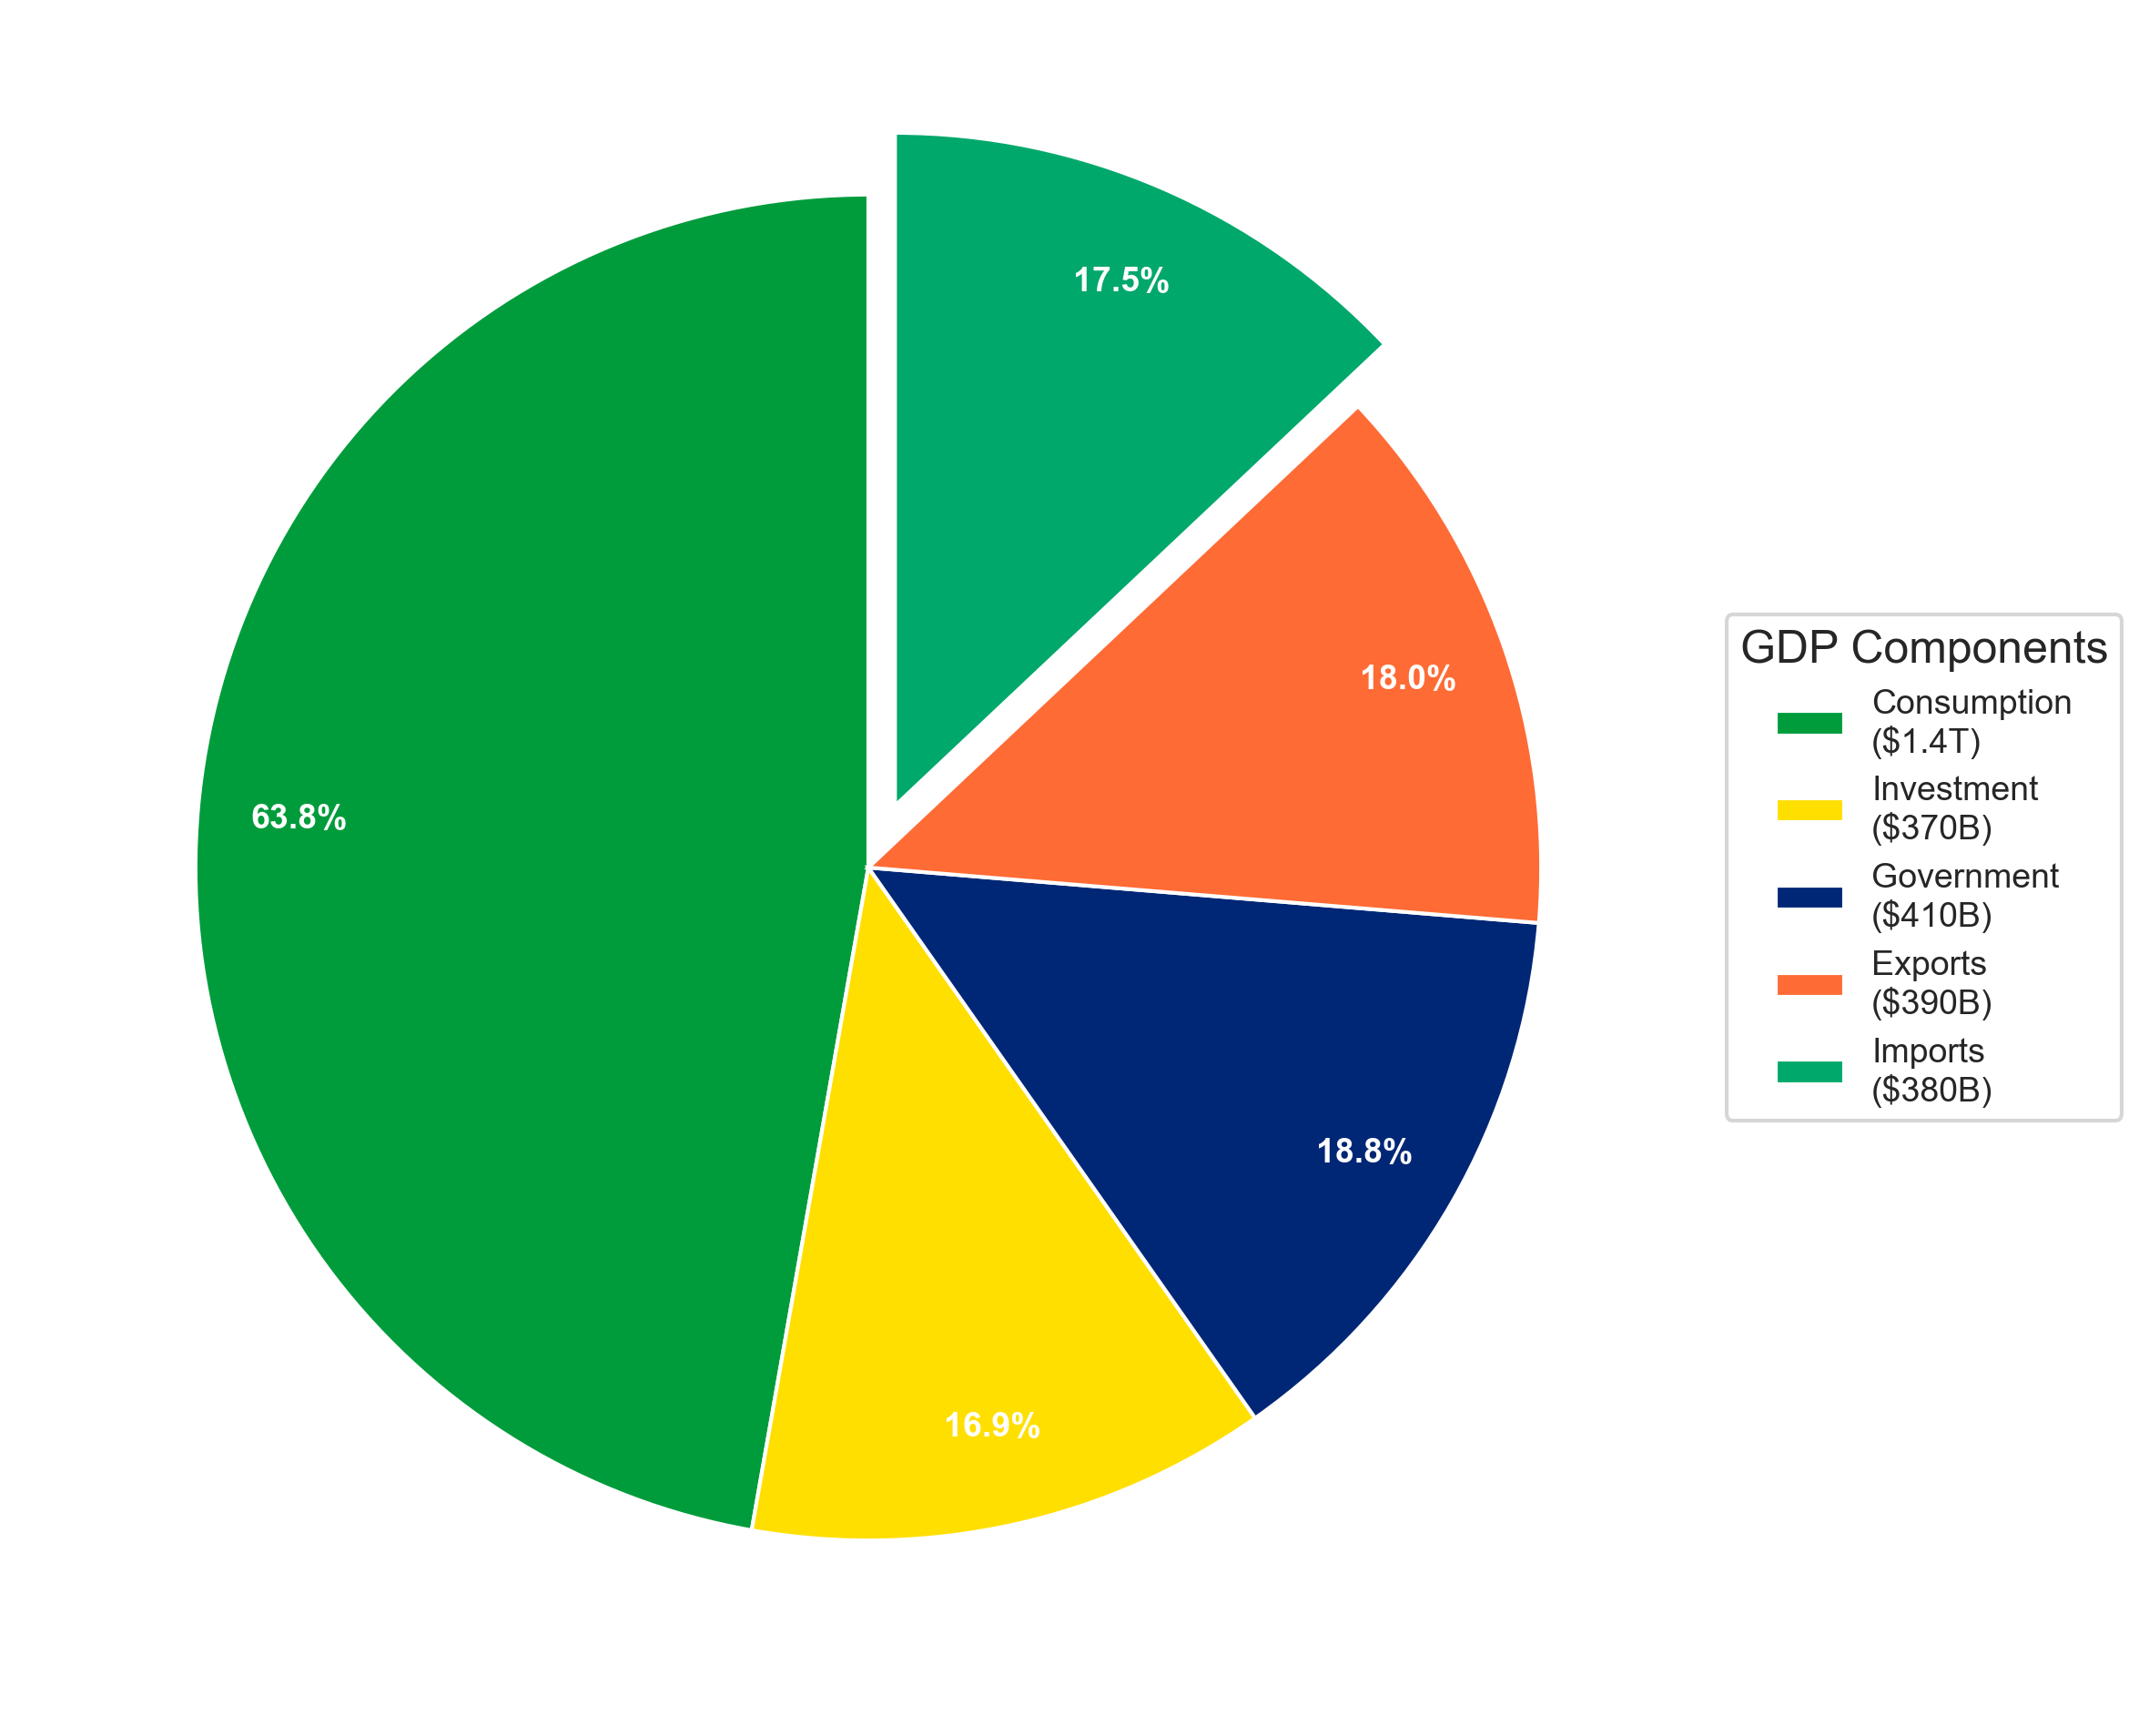
Brazil GDP Pie Chart 2024 Brazil’s GDP composition 2024 pie chart showing emerging economy breakdown. Brazil showed strong domestic market growth with increasing international trade in agriculture, mining, and services sectors. Figure 1: Brazil GDP Composition Breakdown 2024 - Pie Chart Visualization Brazil GDP Components Table 2024 Detailed breakdown of Brazil’s Gross Domestic Product by expenditure components: Component Amount Percentage Pie Chart % Consumption $1.39T 63.8% 47.2% Investment $370B 16.9% 12.5% Government $410B 18.8% 13.9% Exports $390B 18.0% 13.3% Imports $380B -17.5% 13.0% Total GDP $2.18T 100.0% 100.0% Key Economic Insights: Brazil 2024 Primary Economic Driver: Consumption is the largest component of GDP at 63.8% International Trade: Trade surplus with exports at $390B and imports at $380B Investment Level: 16.9% of GDP allocated to capital investment Economic Scale: Total GDP of $2.18T in 2024 Methodology and Data Sources The GDP composition data follows the expenditure approach calculation method and is sourced from World Development Indicators (World Bank). Pie chart percentages are normalized to sum to 100% for clear visual representation. ...