Australia’s economy is services-led — 66.1% of value-added — but carries an unusually large industry sector for a rich country at 25.5%, driven by mining and energy. Agriculture contributes just 2.0% of GDP, though Australia remains one of the world’s biggest food and commodity exporters. Figures are World Bank value-added shares for 2024.
GDP by sector — which industries produce the value
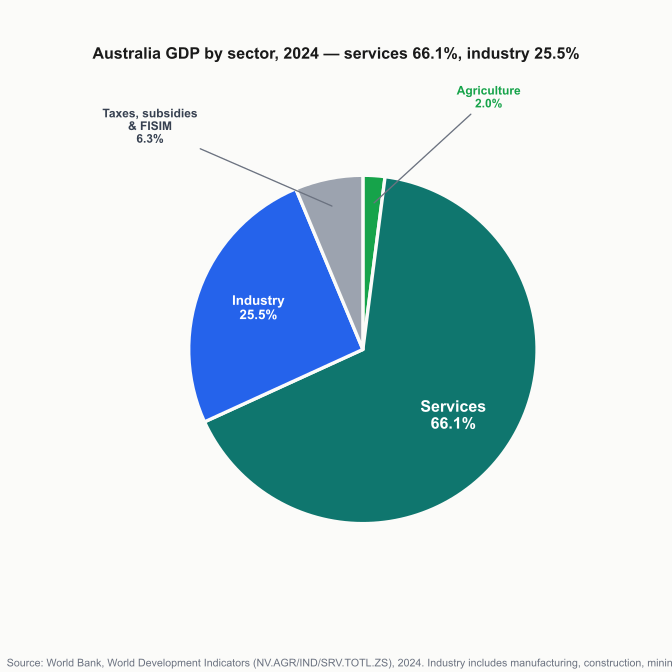
Source: World Bank WDI (NV.AGR/IND/SRV.TOTL.ZS), 2024. Value-added as % of GDP, current prices.
| Sector | Share of GDP | What it includes |
|---|---|---|
| Services | 66.1% | Finance, real estate, retail, healthcare, education, professional services |
| Industry | 25.5% | Mining, manufacturing, construction, utilities |
| Agriculture | 2.0% | Farming, livestock, fishing, forestry |
| Taxes, subsidies & FISIM | 6.3% | National accounts residual — not a sector |
| Total | 100% |
What the numbers say
Australia’s industry share of 25.5% is far higher than the US (16.4%) or UK (17.1%), and the reason is beneath the ground: iron ore, coal, and liquefied natural gas. Mining is a large part of that industry figure, and it powers Australia’s export ties to China, Japan, and South Korea. That is what makes Australia unusual — a high-income, services-heavy economy that still earns much of its living from resources.
Agriculture’s 2.0% share understates Australia’s global role. It is among the world’s largest exporters of wheat, beef, and wool; the small GDP share reflects extremely high output per worker across vast landholdings, not a small industry.
The long view shows the shift. In 1990 industry was 28.8% of GDP and services 59.5%; by 2024 services had climbed to 66.1% as finance, healthcare, and professional services expanded — the same services-isation seen across the rich world, but slower in Australia because the resource sector held its ground.
The 6.3% residual is taxes less subsidies on products plus FISIM (the imputed value of financial services) — a standard national-accounts adjustment, not an industry.
Data note: World Bank NV.* series, 2024, written as published (DATA-POLICY §9.1). World Bank WDI is the authoritative source; values shown are raw, not normalized.
The section below is the original GDP-by-expenditure breakdown — who spends (consumption, investment, government, net trade). It measures something different from the sector chart above: sector = which industries produce the value; expenditure = who spends it. Both are correct; they answer different questions.
Australia GDP Pie Chart 2024
Australia’s GDP composition 2024 pie chart showing resource-driven economy breakdown. Australia’s economy demonstrated resilience with mining exports and services sector dominance, while maintaining strong ties to Asian markets.
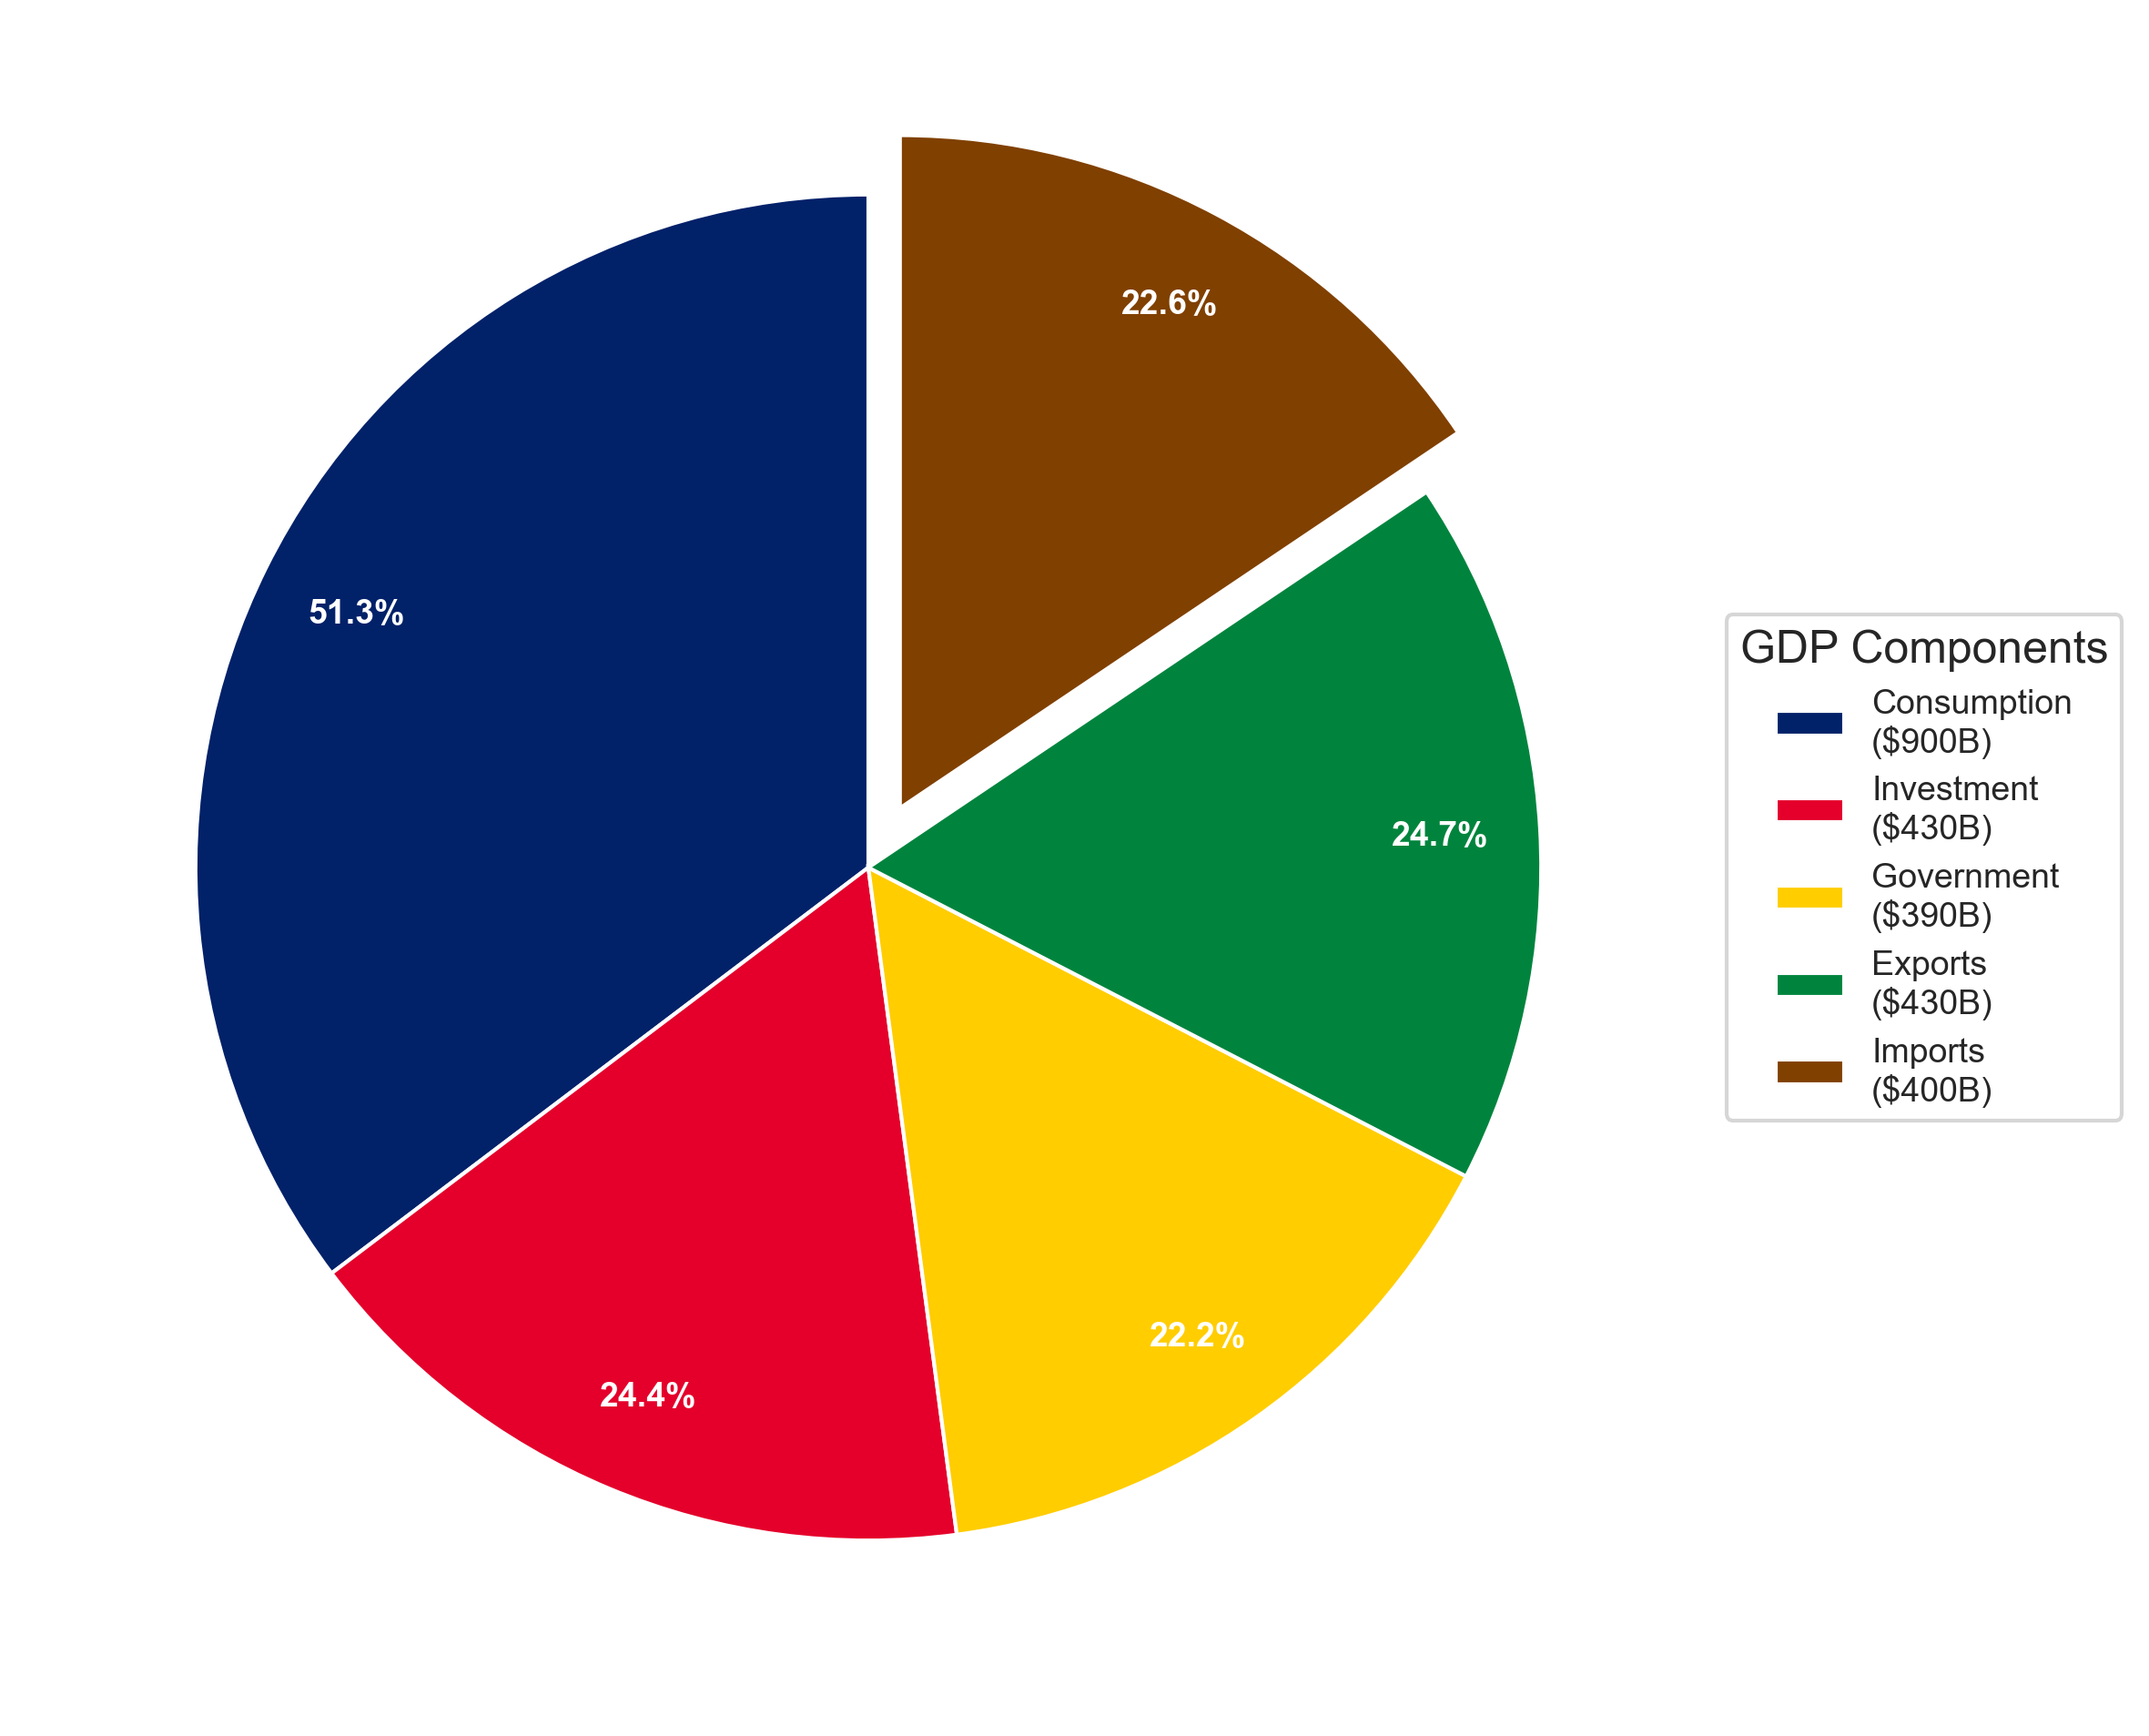
Figure 1: Australia GDP Composition Breakdown 2024 - Pie Chart Visualization
Australia GDP Components Table 2024
Detailed breakdown of Australia’s Gross Domestic Product by expenditure components:
| Component | Amount | Percentage | Pie Chart % |
|---|---|---|---|
| Consumption | $900B | 51.3% | 35.3% |
| Investment | $430B | 24.4% | 16.8% |
| Government | $390B | 22.2% | 15.3% |
| Exports | $430B | 24.7% | 17.0% |
| Imports | $400B | -22.6% | 15.6% |
| Total GDP | $1.75T | 100.0% | 100.0% |
Key Economic Insights: Australia 2024
- Primary Economic Driver: Consumption is the largest component of GDP at 51.3%
- International Trade: Trade surplus with exports at $430B and imports at $400B
- Investment Level: 24.4% of GDP allocated to capital investment
- Economic Scale: Total GDP of $1.75T in 2024
Methodology and Data Sources
The GDP composition data follows the expenditure approach calculation method and is sourced from World Development Indicators (World Bank). Pie chart percentages are normalized to sum to 100% for clear visual representation.
Note: Due to statistical discrepancies in data collection and rounding, the sum of individual components may not exactly equal the total GDP. Data represents the most recent available figures for 2024.